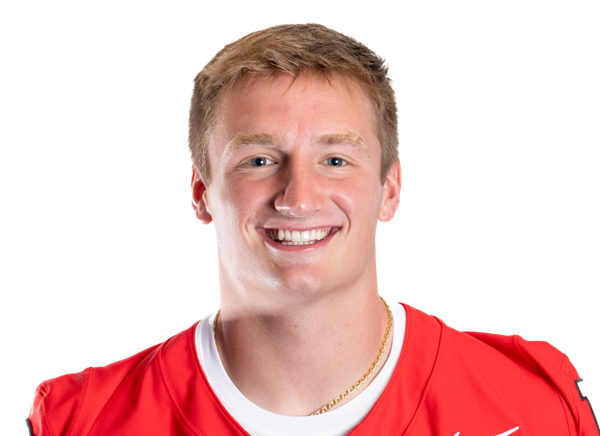
Compares 2026 play-by-play and box score data against 44 qualified QBs across 1 games.
Closest statistical profile
A label for the percentile pattern on the right, not a scouting judgment.
Throws deep more often than most QBs and gains more yards per attempt.
Sack rate of 3.0% ranks in the top 1% of qualified QBs.
He has more deep (15+ air yard) attempts than most (deep throw rate 25.0%, top 1% of QBs).
Completion rate of 45.5% ranks in the bottom 2% of qualified QBs.
EPA / dropback of -0.50 ranks in the bottom 9% of qualified QBs.
1 NFL season and 186 career passing yards. Best year: 186 in 2026.
Strengths
Areas to watch
Percentile vs. QBs
| Wk | Opp | C/Att | Pass Yds | Pass TD | INT | Car | Rush Yds | Rush TD | Tgt | Rec | Rec Yds | Rec TD | PPR |
|---|---|---|---|---|---|---|---|---|---|---|---|---|---|
| 4 | vs IND | 15/33 | 186 | 1 | 1 | 3 | 16 | 0 | — | — | — | — | 11.0 |
| Season | Team | GP | CMP | ATT | CMP% | YDS | AVG | TD | INT | LNG | SACK | RTG | QBR |
|---|---|---|---|---|---|---|---|---|---|---|---|---|---|
| 2026 | WSH | 1 | 15 | 33 | 45.5 | 186 | 5.6 | 1 |
Colored bars are quality measures. Gray "style" bars show how often he does something, not whether it's good.
| 1 |
| 48 |
| 1 |
| 60.9 |
| 20.4 |
| Career | 1 | 15 | 33 | 45.5 | 186 | 5.6 | 1 | 1 | 48 | 1 | 60.9 | - | |
|---|---|---|---|---|---|---|---|---|---|---|---|---|---|
| Season | Team | GP | CAR | YDS | AVG | TD | LNG | FD | FUM | LST |
|---|---|---|---|---|---|---|---|---|---|---|
| 2026 | WSH | 1 | 3 | 16 | 5.3 | 0 | 9 | 0 | 0 | 0 |
| Career | 1 | 3 | 16 | 5.3 | 0 | 9 | 0 | 0 | 0 | |
| Season | Team | GP | PASS | RUSH | REC | RET | TD | 2PT | PAT | FG | PTS |
|---|---|---|---|---|---|---|---|---|---|---|---|
| 2026 | WSH | 1 | 1 | 0 | 0 | 0 | 0 | 0 | 0 | 0 | 0 |
| Career | 1 | 1 | 0 | 0 | 0 | 0 | 0 | 0 | 0 | 0 | |

 Washington Commanders