
Offense
595 plays · 10 games
- Run-firstRuns on 55% of neutral early downs (league 49%).
- Neutral pass rate
- 45% lg 51%
- Shotgun rate
- 56% lg 61%
- Deep pass rate
- 18% lg 19%
- Edge-run share (left/right end runs ÷ all runs with a charted direction)
- 22%

2026 season
3-7 · 12th in National Football Conference · Head coach Kevin Stefanski · Mercedes-Benz Stadium
GameLens rank
#20
-4.7 pts
Off EPA
-0.16
per play
Def EPA
+0.11
allowed
ATL rank #20 of 32 in GameLens, -4.7 pts vs. an average team on a neutral field. Identity: run-first.
Full analysisBuilt from 10 games, so one result still moves the rating a lot. Scheme labels are inferred from play-by-play; coverage and rusher counts aren't charted.
After Week 9 vs. After Week 10 (L 13-35 vs KC).
Summary: Game grade 14/100 for the L 13-35 vs KC, ranked against every team-game this season. Rating effect: -3.2 pts (after Week 9 → after Week 10, before injuries). No single factor accounts for most of the change: performance vs. expectation -1.5, recent-game weighting -1.0, opponent adjustment -0.6, sample size -0.1.
Identified from 2026 play-by-play and compared against the league average.
595 plays · 10 games
Where opponents throw against them, and who is credited with sacks and QB hits, across 10 games and 380 opponent dropbacks. Coverage shells and rusher counts aren't in the data, so any coverage label is an inference.
Where opponents throw, how often they complete, and how often the rush records pressure (a sack or QB hit), from 380 opponent dropbacks. Coverage leans below are inferred from these, not charted.
Completion % allowed by zone
3WR 1TE
| # | Player | Pos | Age | Ht | Wt | Exp | College |
|---|---|---|---|---|---|---|---|
| 1 | TT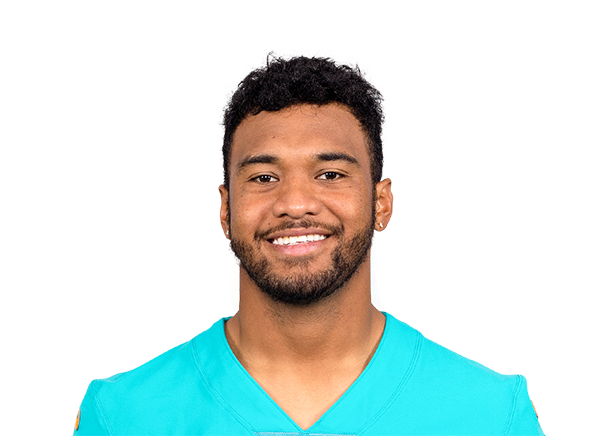 Tua Tagovailoa | QB | 28 | 6' 1" | 225 | 7 | Alabama |
| 9 | MP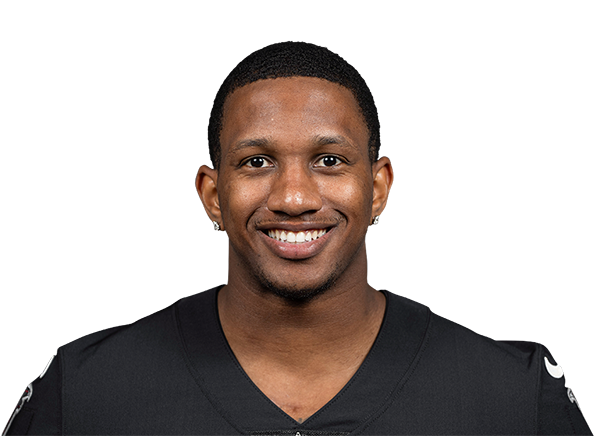 Michael Penix Jr. |
These four parts add up exactly to the total before rounding. "Biggest factor" is shown only when one part moved the same way as the total and makes up at least 60% of the movement.
* Steps don't add up exactly because of rounding. Exact: -3.63 − 1.05 − 0.00 injuries = -4.68. Each number is rounded to one decimal on its own, so −0.1 of this step is rounding.
The team hasn't played since After Week 10, so its own results are unchanged. Its rating still moves because each win or loss is worth more or less as those opponents' ratings update: a game against an opponent who has since looked stronger counts for more.
No high-impact players on the current injury report.
From today's ESPN injury report (total 0.0 pts). ESPN doesn't publish past reports, so this shows current status rather than a week-over-week change.
Each cell: completion %, yards per attempt and attempts (n). Green is at least 5 points below the league completion rate for that zone, red at least 5 above. Cells with fewer than 5 attempts stay neutral.
Defenders named in pass-play descriptions
Attribution: the first defender named in parentheses after the receiver in ESPN's play text. That is usually the tackler on a catch or the defender credited on an incompletion, not a charted coverage assignment. Only throws with a charted depth count, and defenders need at least 4 such targets.
| Defender | Tgts | Comp% | Yds/Tgt | TD |
|---|---|---|---|---|
| C.HendersonUnlisted | 35 | 74% | 9.2 | 0 |
| J.BatesUnlisted | 30 | 90% | 8.8 | 0 |
| X.WattsFree safety | 28 | 96% | 13.4 | 0 |
| K.DanielsLeft inside LB | 28 | 93% | 5.9 | 0 |
| M.HughesRight corner | 23 | 78% | 11.0 | 0 |
| H.PerkinsRight inside LB | 18 | 94% | 5.2 | 0 |
Recorded pressure means a sack or QB hit. Each one is tied to the rusher's spot on the "Base 3-4 D" depth chart. Pressure credited to a linebacker or defensive back is treated as a likely blitz.
Recorded pressure
18%
67 of 380 drops · lg 17%
LB/DB pressure share
9%
6 of 67 pressures
Sacks
24
6% of 380 drops
Recorded pressure counts only sacks and QB hits; hurries are not in the play-by-play. LB/DB pressure share is a blitz proxy, not a blitz rate: it only sees blitzes that got home.
Where the pressure comes from
When they bring it
| Situation | Drops | Pressure vs league | LB/DB pressure |
|---|---|---|---|
| 1st down | 148 | 18% / 14% | 1% |
| 2nd down | 121 | 12% / 14% | 0% |
| 3rd & short (1-3) | 22 | 23% / 18% | 0% |
| 3rd & medium (4-6) | 28 |
Top blitzers
647 plays · 10 games
In for Zachariah Branch (Out)
Base 3-4 D
| QB |
| 26 |
| 6' 3" |
| 220 |
| 3 |
| Washington |
| 13 | AD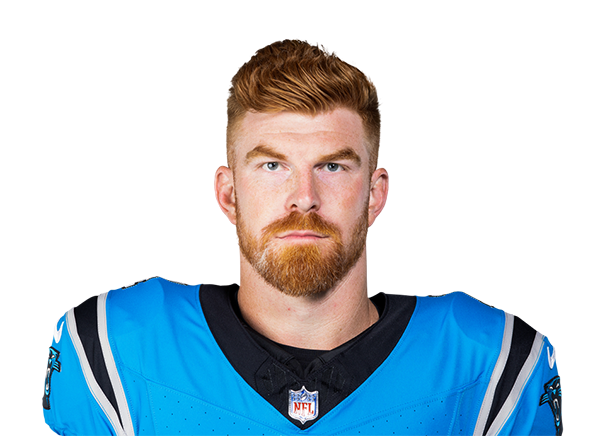 Andy Dalton | QB | 39 | 6' 2" | 220 | 16 | TCU |
|---|
| 18 | JSJack Strand | QB | 22 | 6' 5" | 240 | R | Minnesota St Moorhead |
|---|
| 7 | BR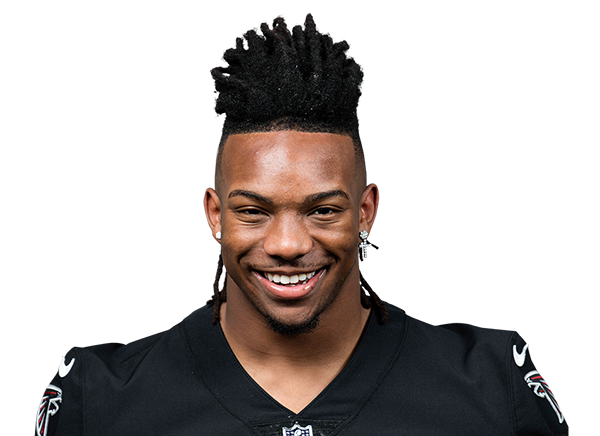 Bijan Robinson | RB | 24 | 5' 11" | 215 | 4 | Texas |
|---|
| 40 | KH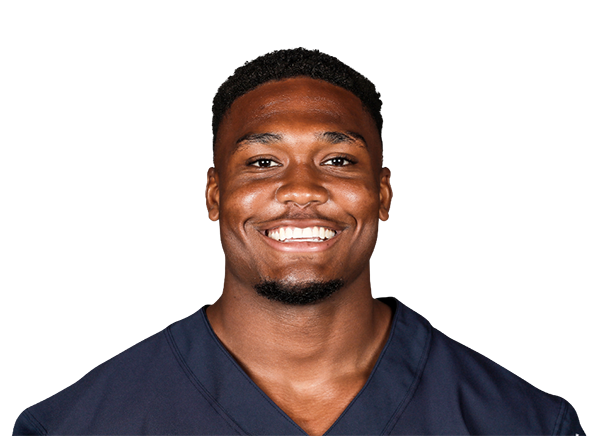 Khalil Herbert | RB | 28 | 5' 9" | 212 | 6 | Virginia Tech |
|---|
| 4 | JD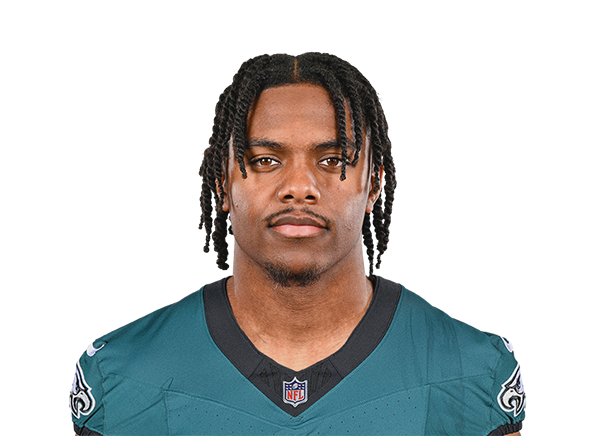 Jahan Dotson | WR | 26 | 5' 11" | 184 | 5 | Penn State |
|---|
| 5 | DL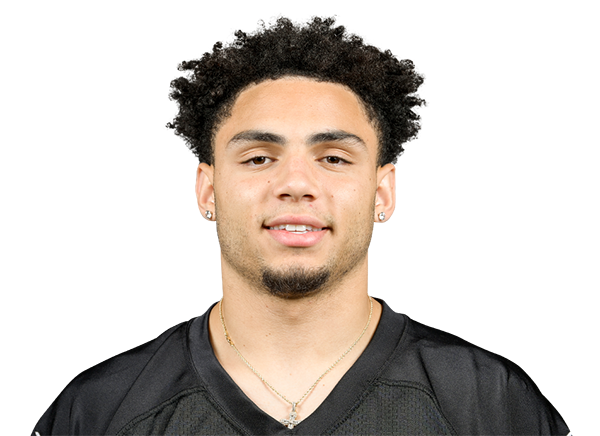 Drake London | WR | 25 | 6' 4" | 215 | 5 | USC |
|---|
| 14 | OZ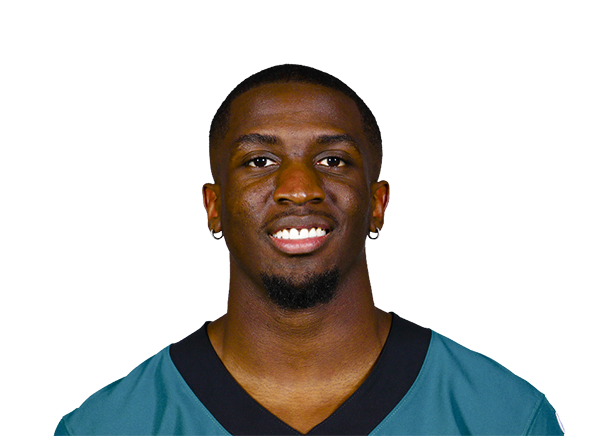 Olamide Zaccheaus | WR | 29 | 5' 8" | 194 | 8 | Virginia |
|---|
| 17 | ZB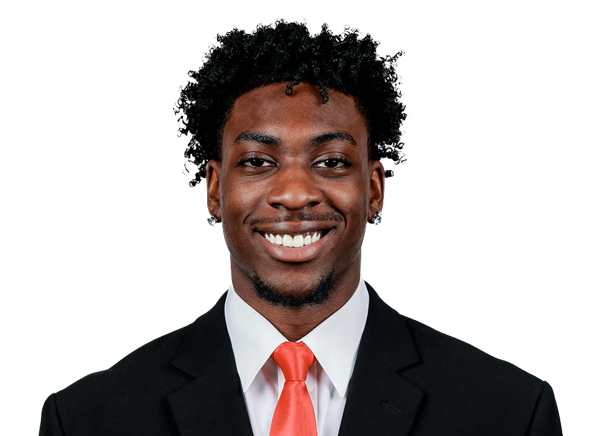 Zachariah BranchOut | WR | 22 | 5' 10" | 180 | R | Georgia |
|---|
| 19 | CB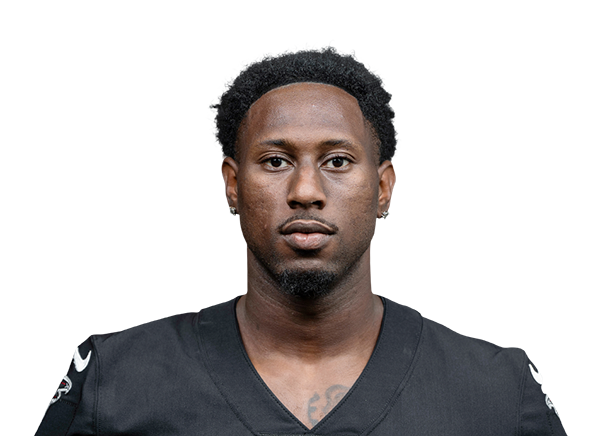 Chris Blair | WR | 29 | 6' 2" | 215 | 2 | Alcorn State |
|---|
| 88 | BC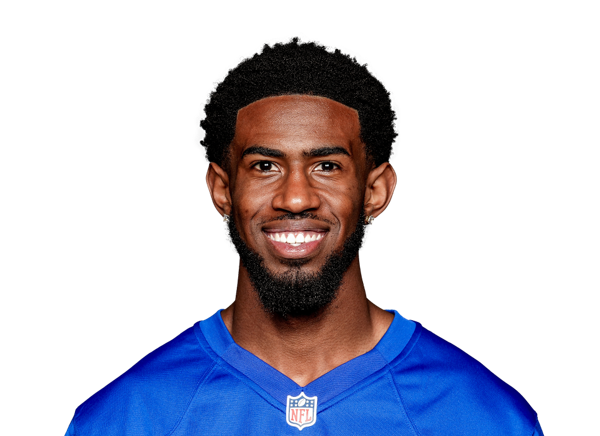 Beaux Collins | WR | 23 | 6' 3" | 206 | 2 | Notre Dame |
|---|
| 8 | KP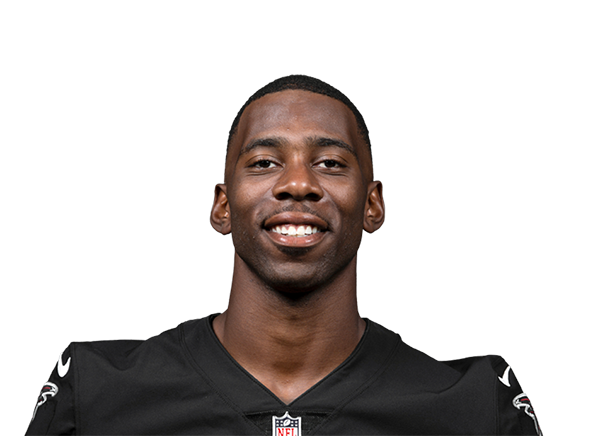 Kyle Pitts Sr. | TE | 26 | 6' 6" | 250 | 5 | Florida |
|---|
| 81 | AH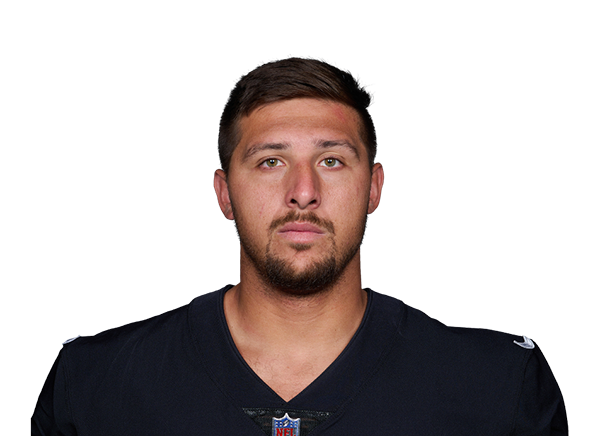 Austin Hooper | TE | 32 | 6' 4" | 254 | 11 | Stanford |
|---|
| 87 | NM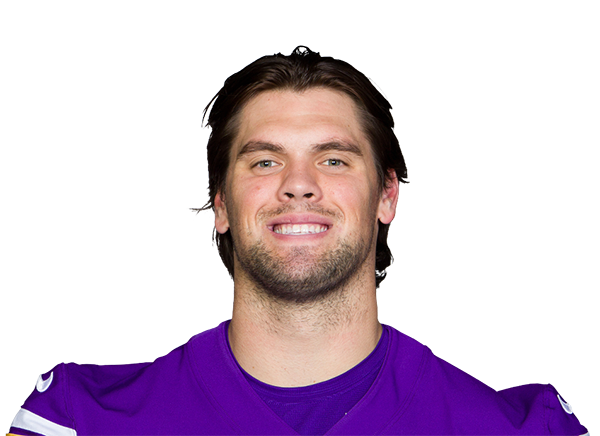 Nick Muse | TE | 27 | 6' 5" | 252 | 3 | South Carolina |
|---|
| 89 | CW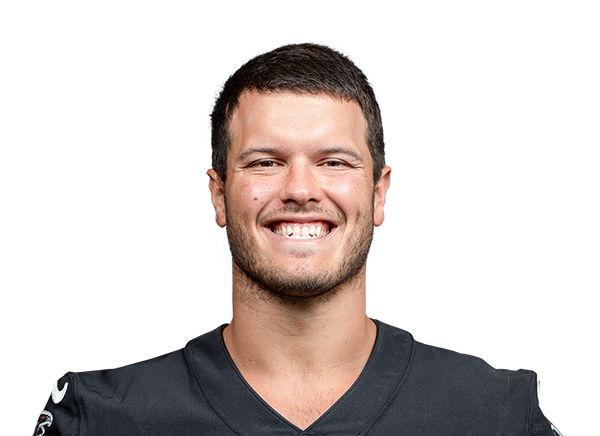 Charlie Woerner | TE | 29 | 6' 5" | 250 | 7 | Georgia |
|---|
| 70 | JM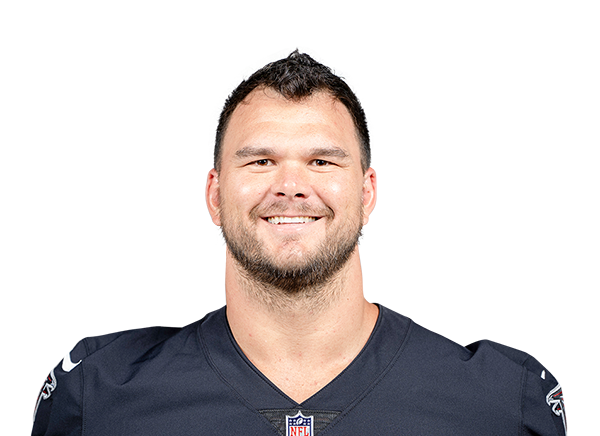 Jake Matthews | OT | 34 | 6' 5" | 310 | 13 | Texas A&M |
|---|
| 71 | JT Jawaan Taylor | OT | 28 | 6' 5" | 312 | 8 | Florida |
|---|
| 75 | EO Ethan Onianwa | OT | 23 | 6' 7" | 331 | R | Ohio State |
|---|
| 62 | CL Corey Levin | G | 32 | 6' 4" | 307 | 8 | Chattanooga |
|---|
| 63 | CL Chris Lindstrom | G | 29 | 6' 4" | 310 | 8 | Boston College |
|---|
| 65 | MB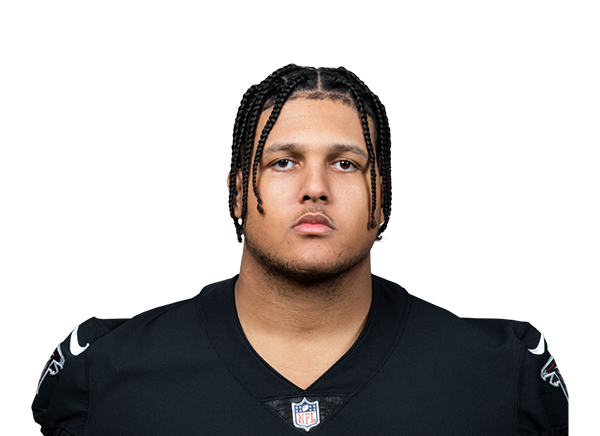 Matthew Bergeron | G | 26 | 6' 5" | 315 | 4 | Syracuse |
|---|
| 68 | KH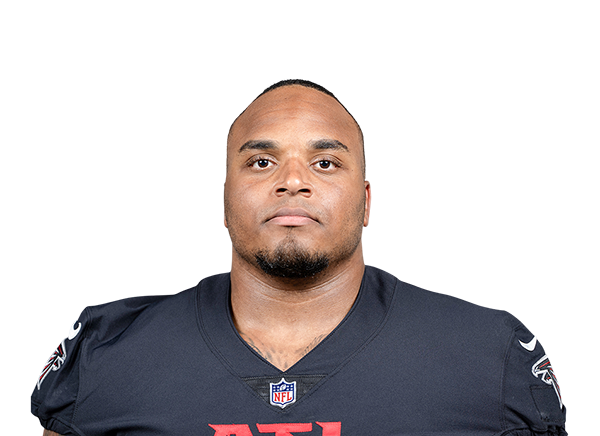 Kyle Hinton | G | 28 | 6' 2" | 315 | 4 | Washburn |
|---|
| 72 | AV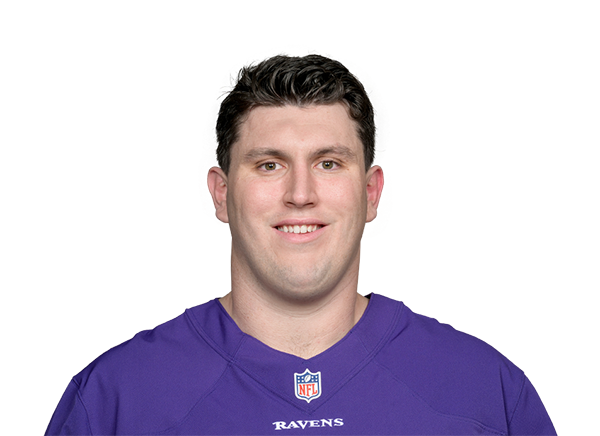 Andrew Vorhees | G | 27 | 6' 6" | 320 | 3 | USC |
|---|
| 73 | CW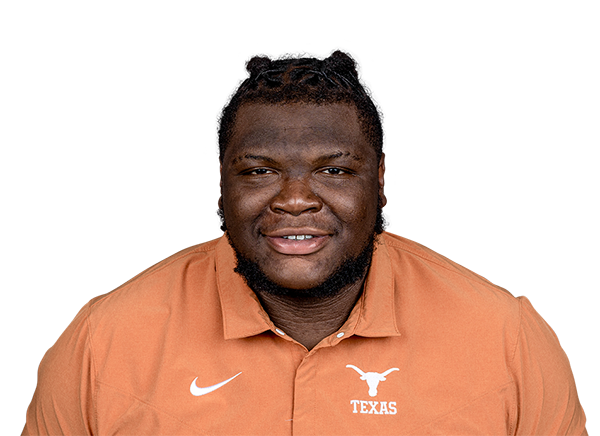 Cameron Williams | OL | 23 | 6' 6" | 317 | 2 | Texas |
|---|
| # | Player | Pos | Age | Ht | Wt | Exp | College |
|---|---|---|---|---|---|---|---|
| 55 | ZS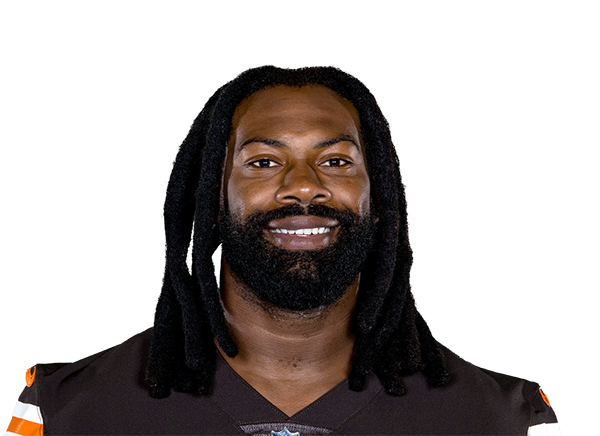 Za'Darius Smith | DE | 34 | 6' 4" | 270 | 11 | Kentucky |
| 94 | LL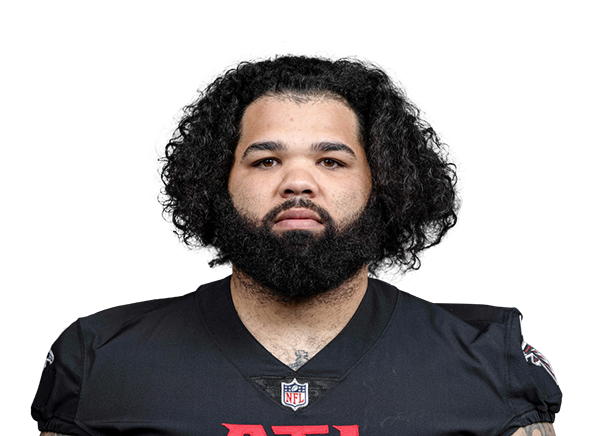 LaCale London | DE | 29 | 6' 3" | 297 | 3 | Western Illinois |
| 96 | ZH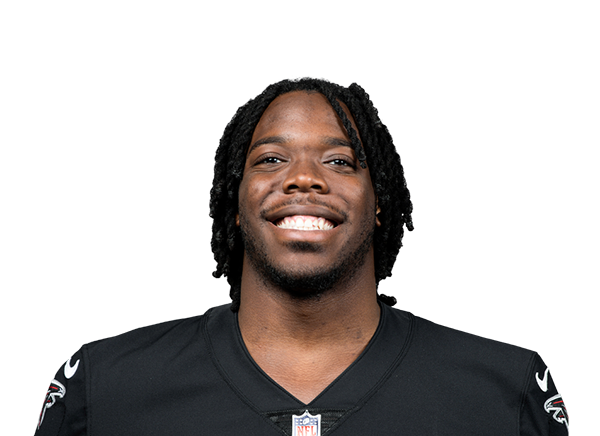 Zach Harrison | DE | 25 | 6' 5" | 270 | 4 | Ohio State |
| 99 | CT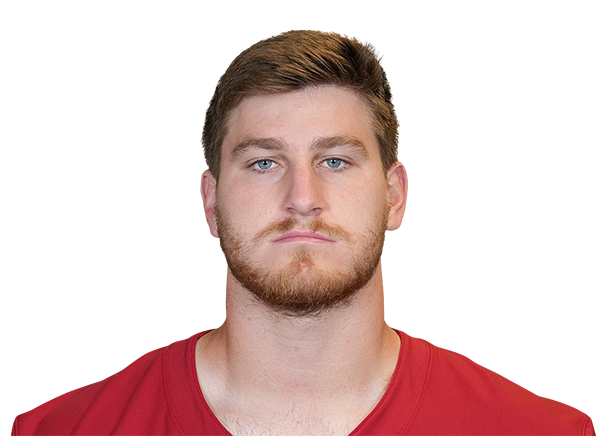 Cameron Thomas | DE | 26 | 6' 4" | 265 | 5 | San Diego State |
| 54 | BD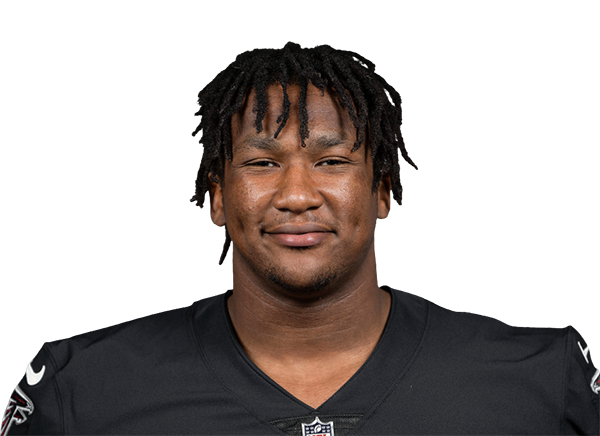 Brandon Dorlus | DT | 25 | 6' 3" | 295 | 3 | Oregon |
| 92 | MS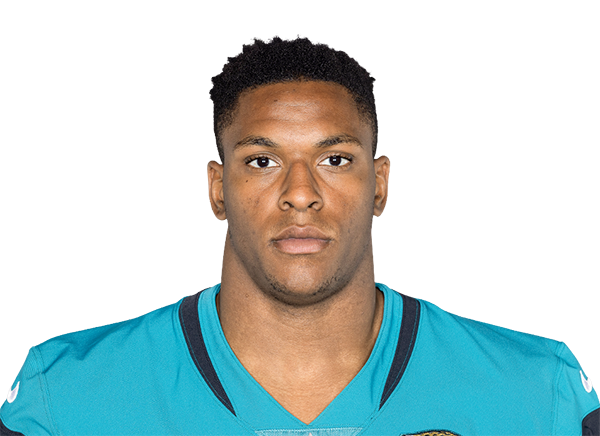 Maason Smith | DT | 24 | 6' 5" | 306 | 3 | LSU |
| 95 | GD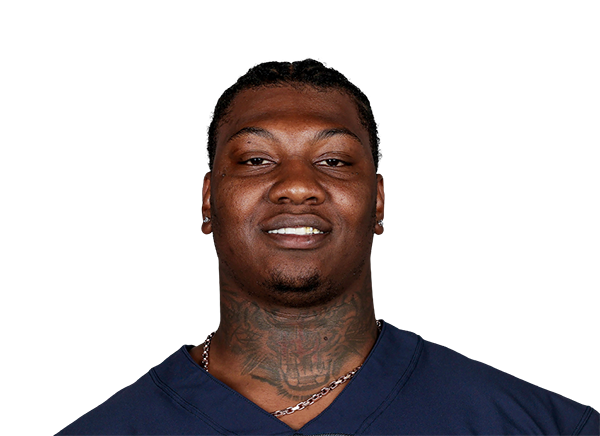 Gervon Dexter Sr. | DT | 26 | 6' 6" | 326 | 4 | Florida |
| 0 | DD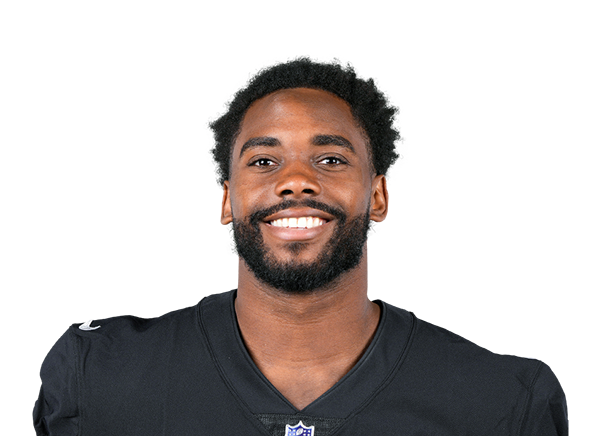 Divine DeabloOut | LB | 28 | 6' 3" | 223 | 6 | Virginia Tech |
| 11 | JW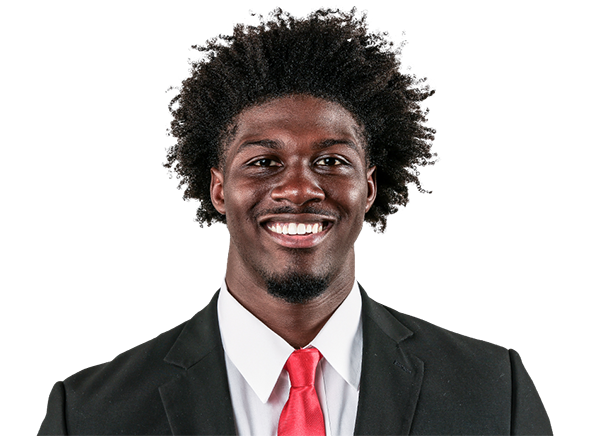 Jalon WalkerInjured Reserve | LB | 22 | 6' 2" | 245 | 2 | Georgia |
| 22 | YA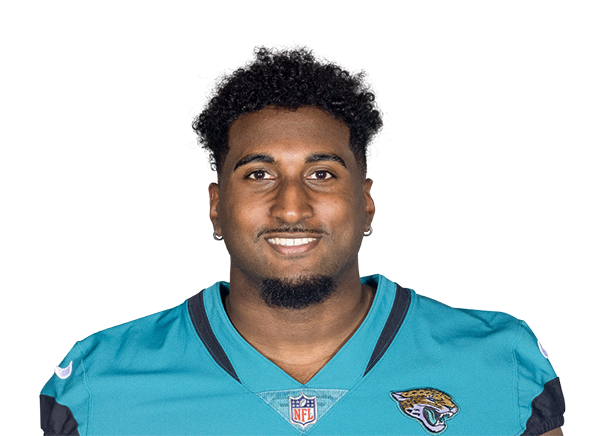 Yasir Abdullah | LB | 26 | 6' 1" | 240 | 4 | Louisville |
| 27 | JP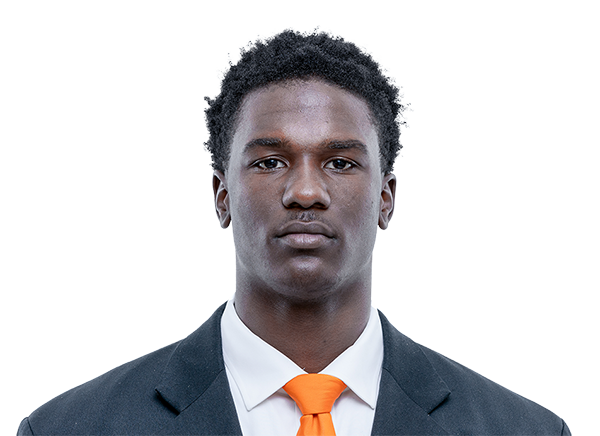 James Pearce Jr. | LB | 23 | 6' 5" | 243 | 2 | Tennessee |
| 43 | TQ TJ Quinn | LB | 23 | 6' 0" | 225 | R | Louisville |
| 45 | CH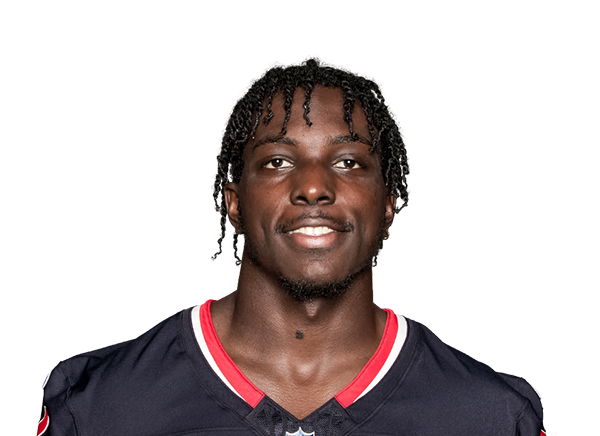 Christian Harris | LB | 25 | 6' 2" | 232 | 5 | Alabama |
| 46 | JW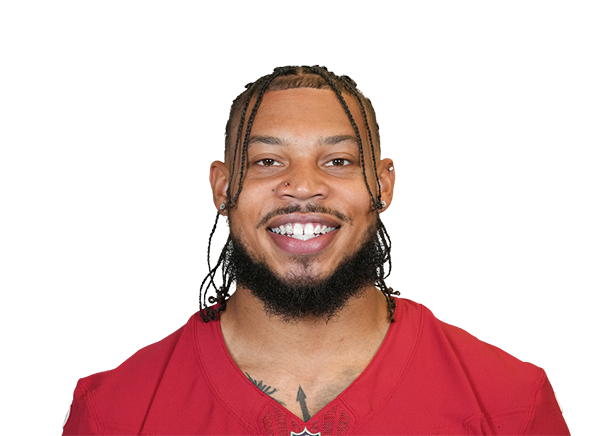 Josh Woods | LB | 30 | 6' 1" | 235 | 7 | Maryland |
| 47 | CS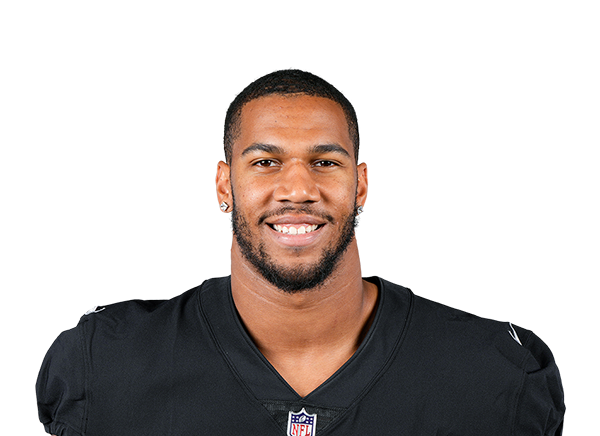 Charles Snowden | LB | 28 | 6' 7" | 240 | 3 | Virginia |
| 53 | KD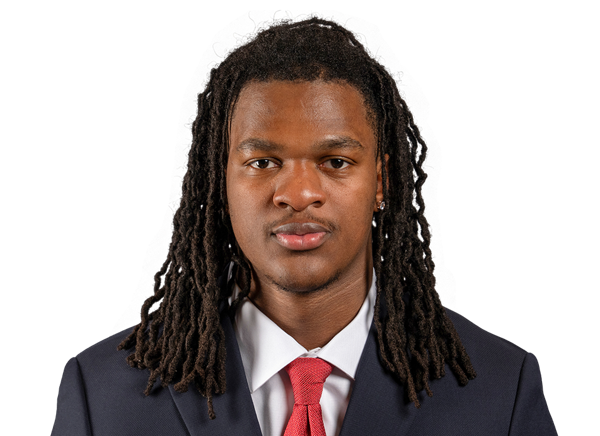 Kendal Daniels | LB | 23 | 6' 5" | 242 | R | Oklahoma |
| 56 | HP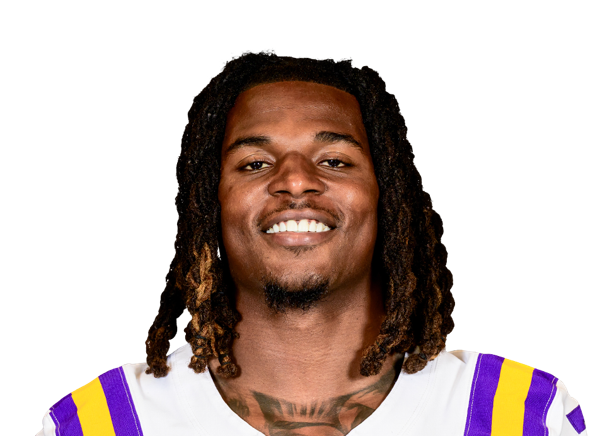 Harold Perkins Jr. | LB | 22 | 6' 0" | 223 | R | LSU |
| 12 | AT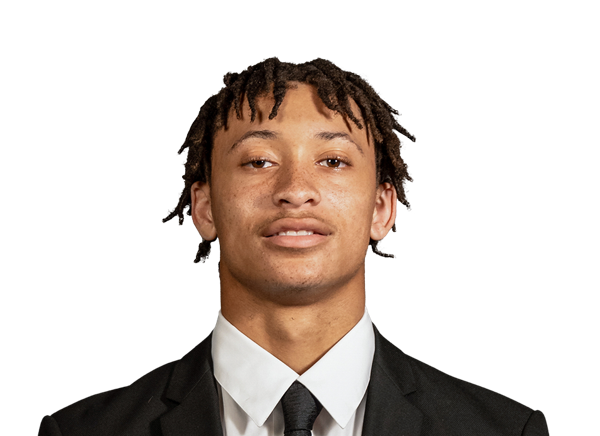 Avieon Terrell | CB | 21 | 5' 11" | 180 | R | Clemson |
| 21 | MH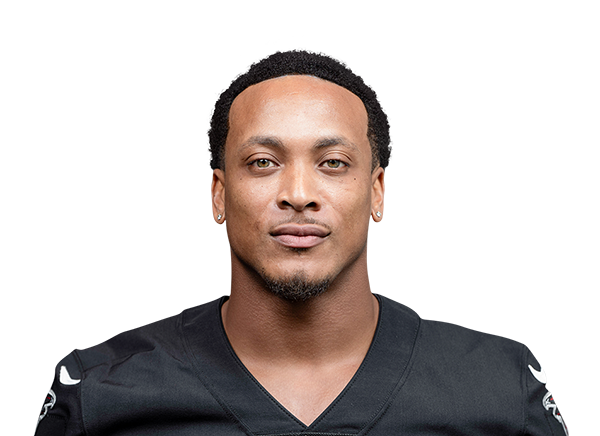 Mike Hughes | CB | 29 | 5' 10" | 190 | 9 | UCF |
| 24 | AT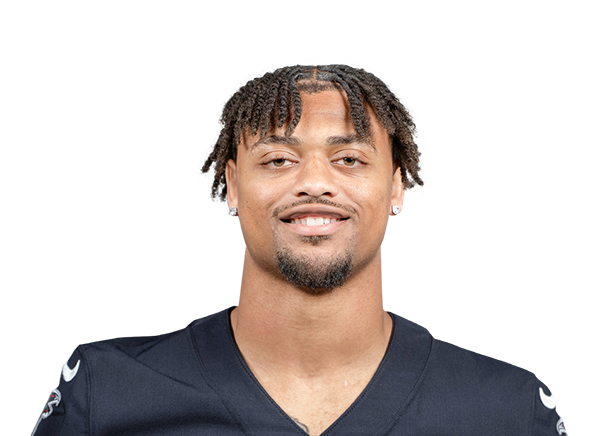 A.J. Terrell Jr. | CB | 28 | 6' 1" | 200 | 7 | Clemson |
| 26 | CH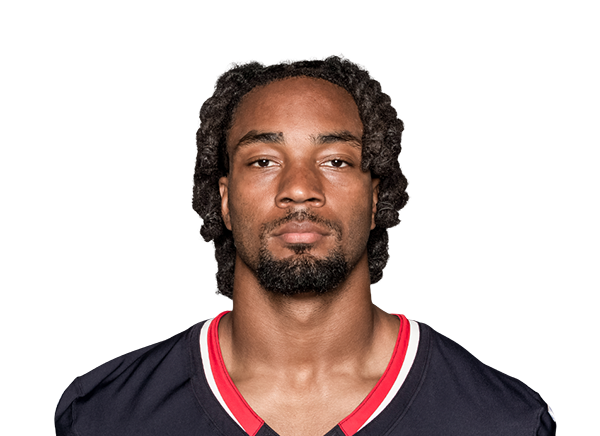 C.J. Henderson | CB | 28 | 6' 1" | 205 | 6 | Florida |
| 28 | MF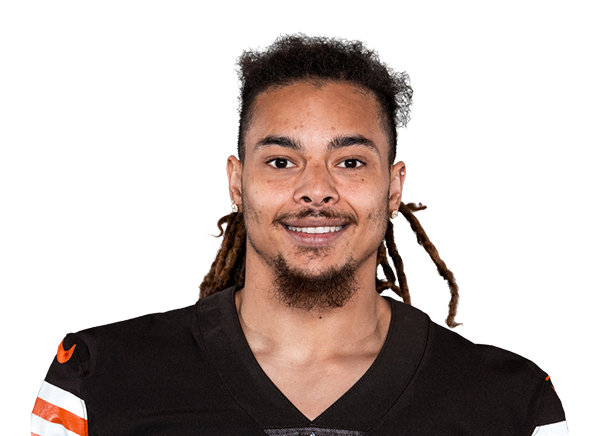 Mike Ford Jr. | CB | 31 | 6' 0" | 199 | 9 | Southeast Missouri State |
| 33 | BB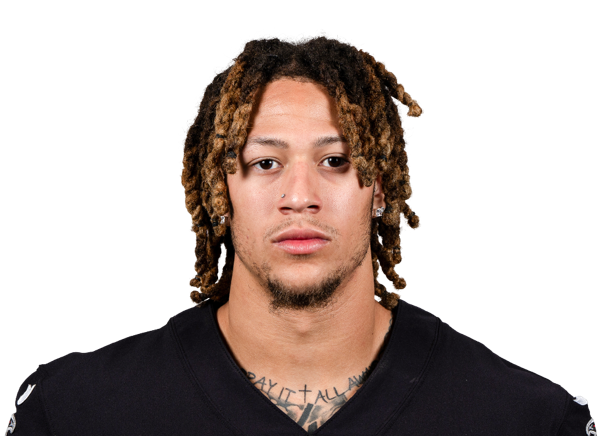 Billy Bowman Jr. | CB | 23 | 5' 10" | 194 | 2 | Oklahoma |
| 37 | RL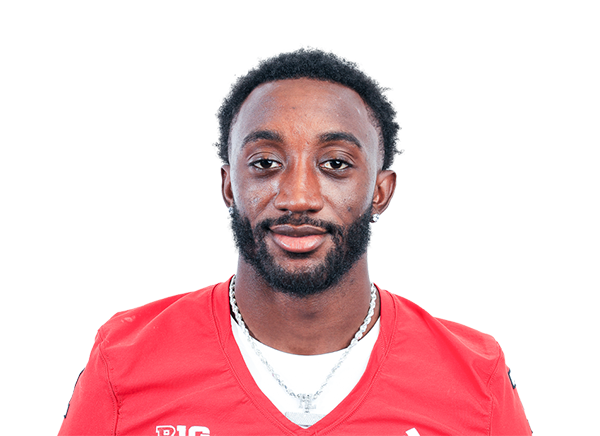 Robert Longerbeam | CB | 25 | 5' 11" | 178 | 2 | Rutgers |
| 23 | DH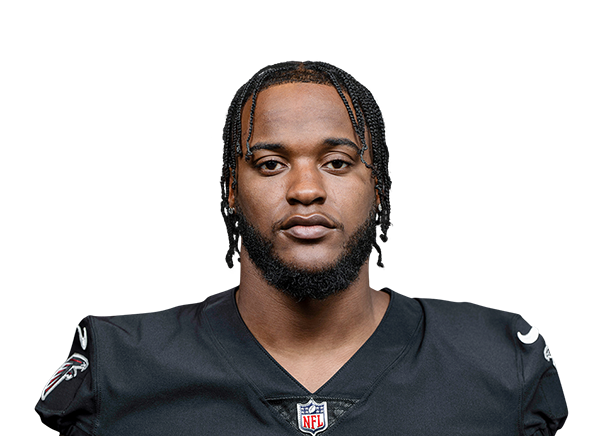 DeMarcco Hellams | S | 26 | 6' 1" | 203 | 4 | Alabama |
| 29 | SB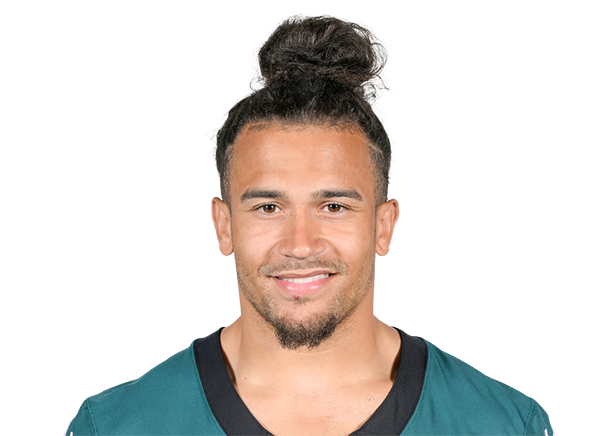 Sydney Brown | S | 26 | 5' 10" | 211 | 4 | Illinois |
| 31 | XW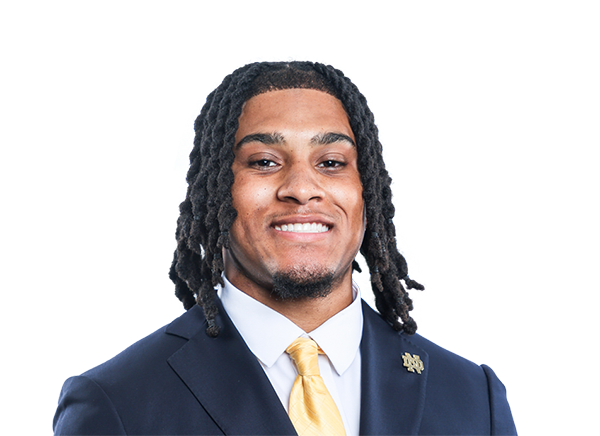 Xavier Watts | S | 24 | 6' 0" | 203 | 2 | Notre Dame |
| 34 | JR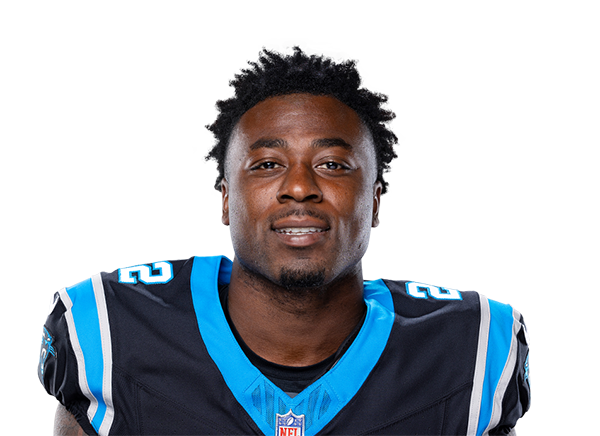 Jammie Robinson | S | 25 | 5' 11" | 195 | 4 | Florida State |
| # | Player | Pos | Age | Ht | Wt | Exp | College |
|---|---|---|---|---|---|---|---|
| 45 | JM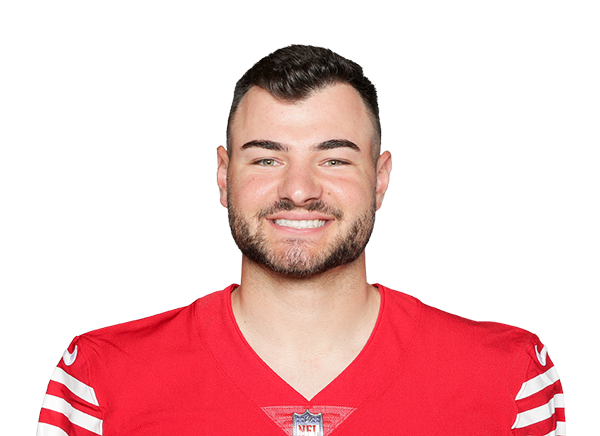 Jake Moody | PK | 26 | 6' 1" | 210 | 4 | Michigan |
| 16 | JB Jake Bailey | P | 29 | 6' 2" | 212 | 8 | Stanford |
| 49 | LM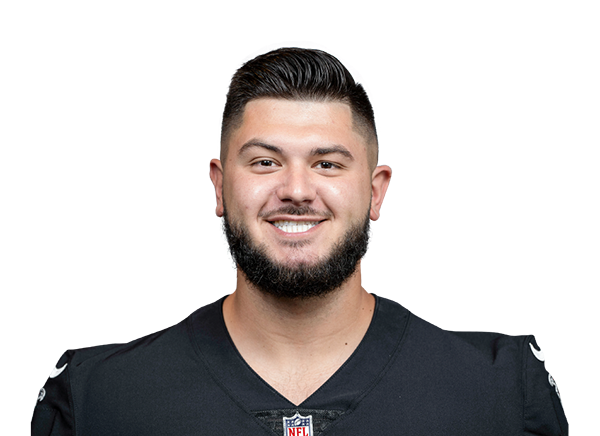 Liam McCullough | LS | 29 | 6' 2" | 245 | 5 | Ohio State |
| # | Player | Pos | Age | Ht | Wt | Exp | College |
|---|---|---|---|---|---|---|---|
| 15 | BR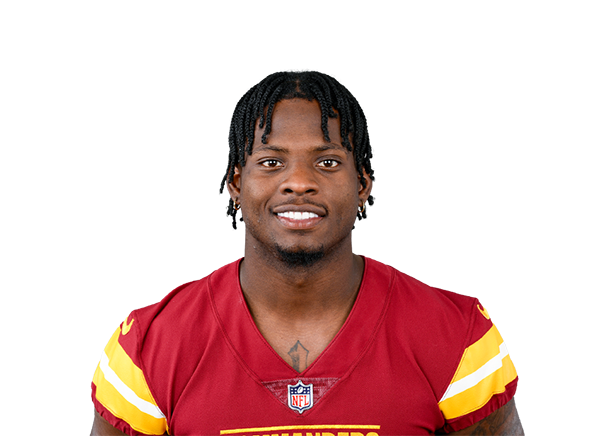 Brian Robinson Jr.Injured Reserve | RB | 27 | 6' 1" | 225 | 5 | Alabama |
| 44 | TS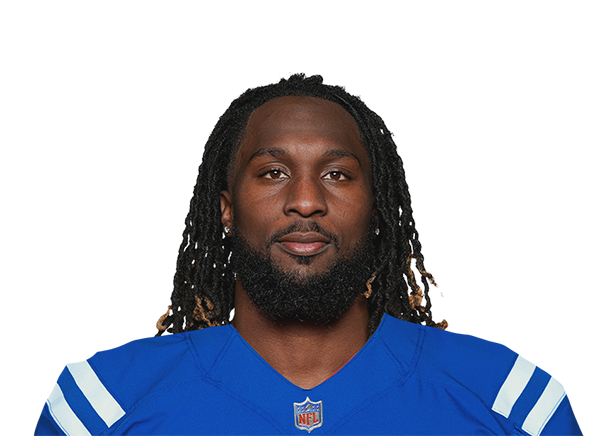 Trey SermonInjured Reserve | RB | 27 | 6' 0" | 215 | 5 | Ohio State |
| 72 | MJ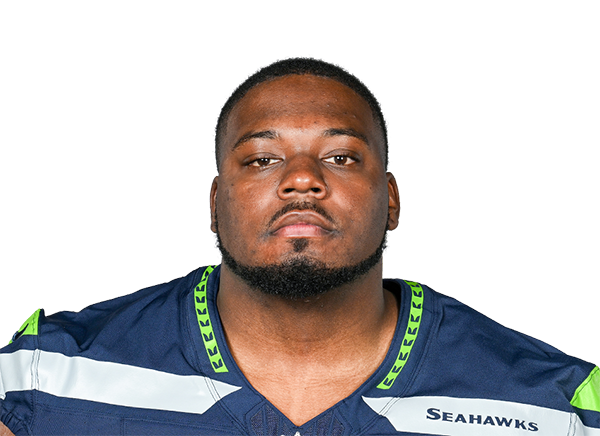 Michael JerrellInjured Reserve | OT | 27 | 6' 5" | 309 | 3 | Findlay |
| 77 | SN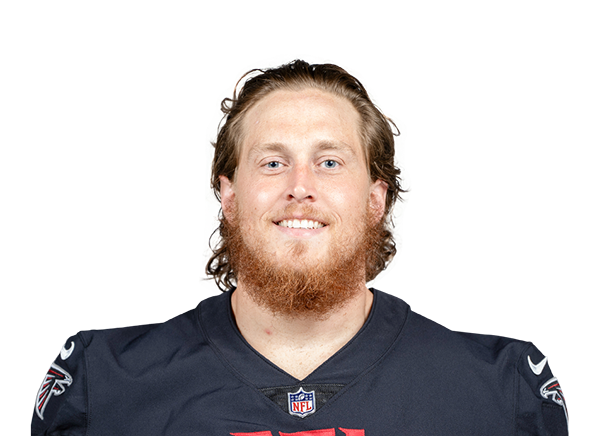 Storm NortonOut | OT | 32 | 6' 7" | 310 | 7 | Toledo |
| 52 | SE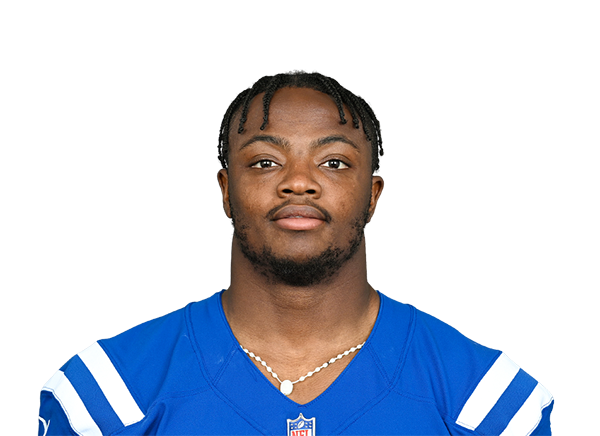 Samson EbukamInjured Reserve | DE | 31 | 6' 3" | 245 | 10 | Eastern Washington |
| 90 | DH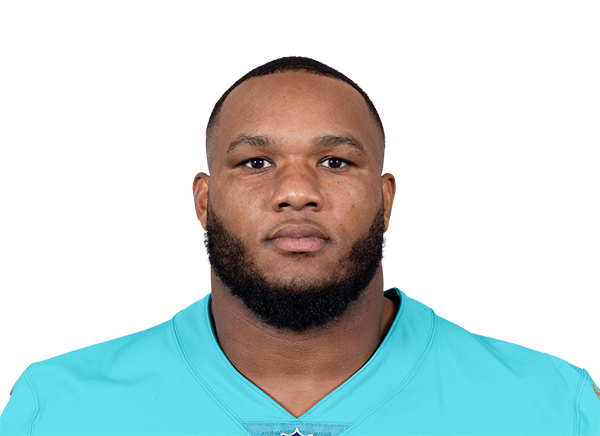 Da'Shawn HandInjured Reserve | DT | 31 | 6' 3" | 302 | 9 | Alabama |
| 98 | AT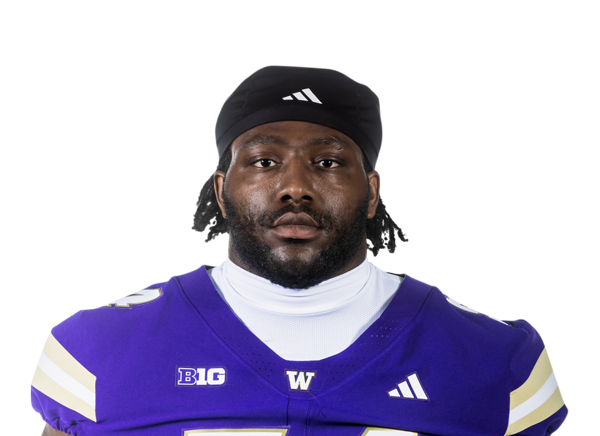 Anterio ThompsonOut | DT | 24 | 6' 4" | 310 | R | Washington |
| 40 | JB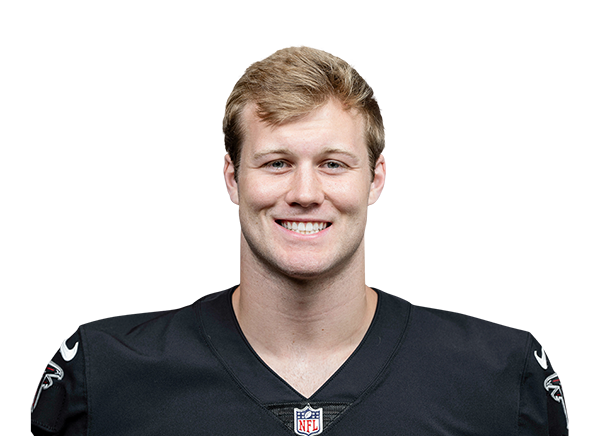 JD BertrandInjured Reserve | LB | 26 | 6' 1" | 230 | 3 | Notre Dame |
| 50 | DM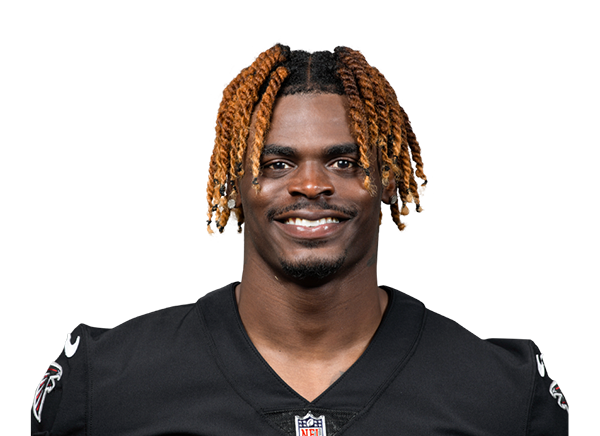 DeAngelo MaloneOut | LB | 27 | 6' 3" | 235 | 5 | Western Kentucky |
| # | Player | Pos | Age | Ht | Wt | Exp | College |
|---|---|---|---|---|---|---|---|
| — | JM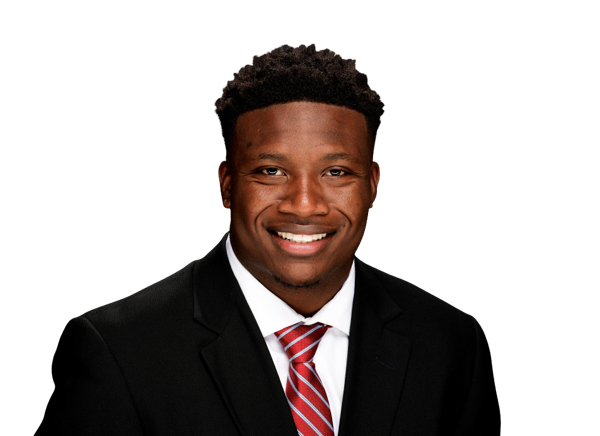 Jam Miller | RB | 22 | 5' 10" | 209 | R | Alabama |
| 80 | DD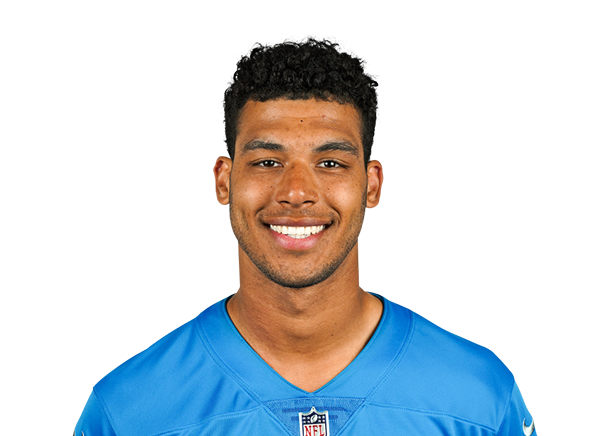 Dylan Drummond | WR | 26 | 6' 0" | 190 | 2 | Eastern Michigan |
| 82 | AW Antwane Wells Jr. | WR | 25 | 6' 0" | 205 | 1 | Ole Miss |
| 86 | VA Vinny Anthony II | WR | 23 | 6' 0" | 190 | R | Wisconsin |
| — | EJ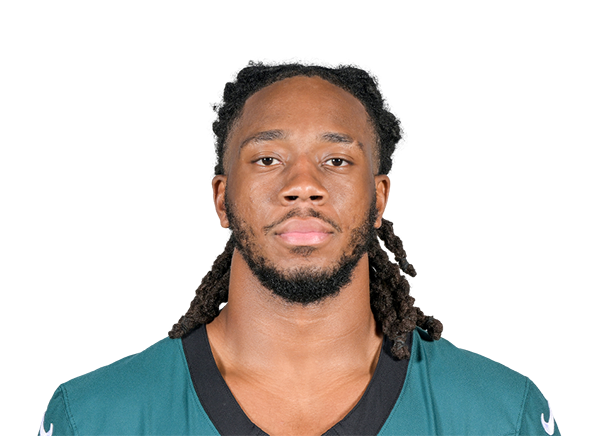 E.J. Jenkins | TE | 28 | 6' 6" | 245 | 2 | Georgia Tech |
| 76 | RM Riley Mahlman | OT | 23 | 6' 8" | 320 | R | Wisconsin |
| — | JT Josh Thompson | G | 24 | 6' 5" | 315 | R | LSU |
| 61 | KD Kam Dewberry | G | 22 | 6' 4" | 332 | R | Alabama |
| 60 | GH Gus Hartwig | C | 24 | 6' 5" | 309 | 2 | Purdue |
| — | ZP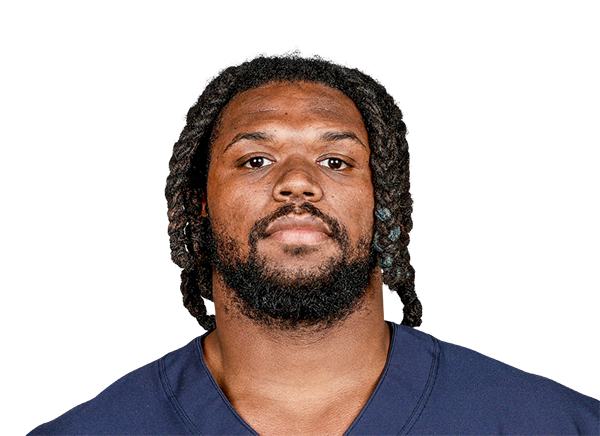 Zacch Pickens | DT | 26 | 6' 4" | 300 | 3 | South Carolina |
| 41 | BA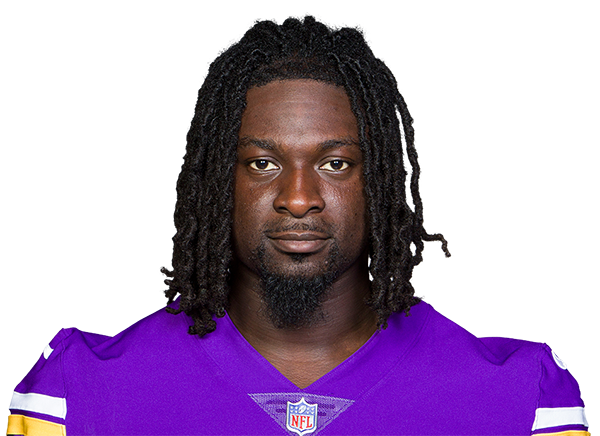 Brian Asamoah II | LB | 26 | 6' 1" | 230 | 4 | Oklahoma |
| 51 | JI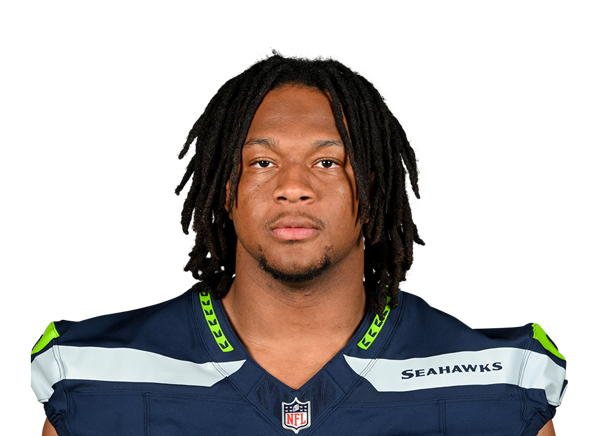 Jared Ivey | LB | 24 | 6' 6" | 274 | 2 | Ole Miss |
| 30 | DH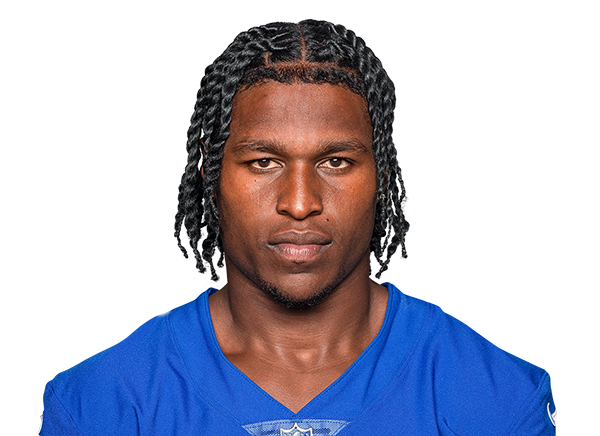 Darnay Holmes | CB | 28 | 5' 9" | 198 | 7 | UCLA |
| 32 | DT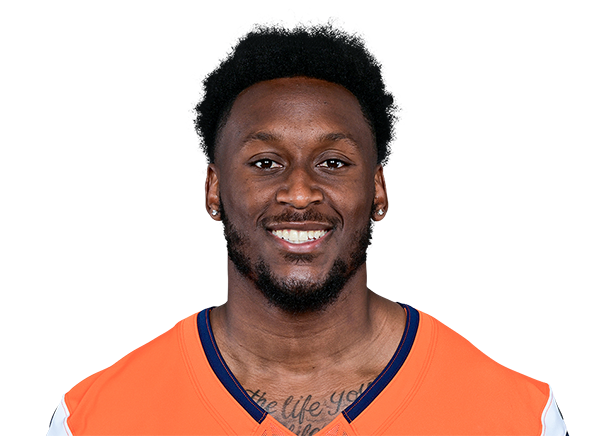 Delarrin Turner-Yell | S | 26 | 5' 11" | 200 | 4 | Oklahoma |
| 0% |
| 3rd & long (7+) | 48 | 21% / 24% | 4% |
| 4th down | 13 | 38% / 22% | 15% |
| Red zone | 64 | 13% / 14% | 2% |
| Two-minute drill | 65 | 17% / 17% | 3% |
The bar shows the team's pressure rate and the tick shows the league rate. LB/DB pressure is the share of dropbacks where a linebacker or DB was credited with a sack or hit. It's a proxy for blitzing, not a true blitz rate: ESPN play-by-play doesn't log rusher counts, so blitzes that don't get home aren't visible.
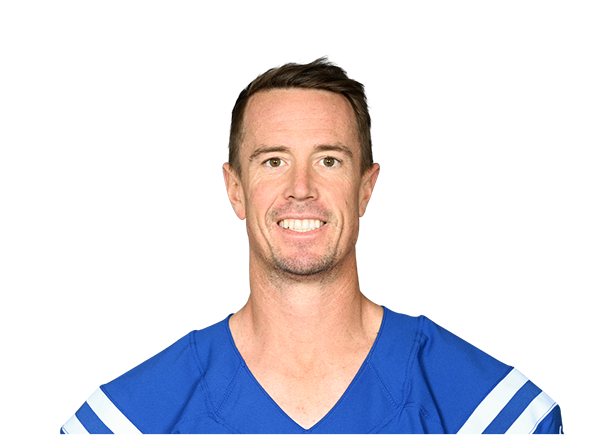
Matt Ryan
2008–2021
59,735
Matt Ryan
2008–2021
367
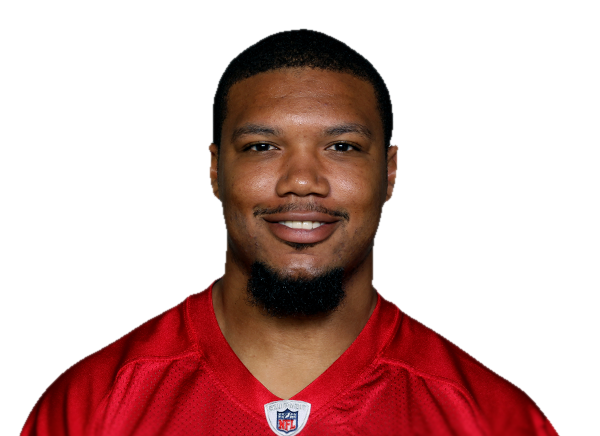
Michael Turner
2008–2012
6,081
Michael Turner
2008–2012
60
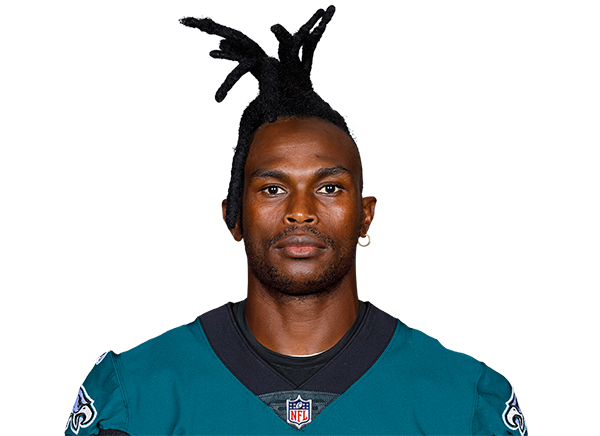
Julio Jones
2011–2020
848
Julio Jones
2011–2020
12,896
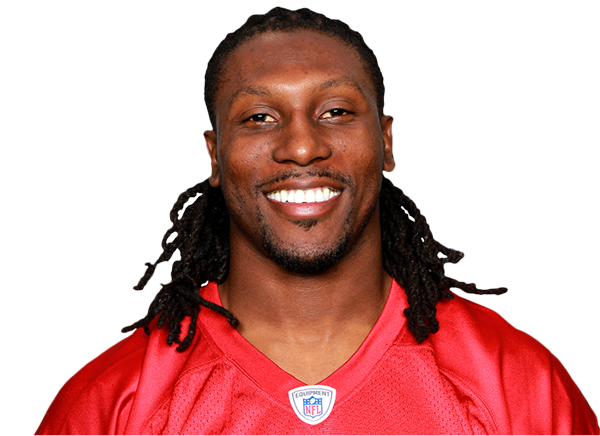
Roddy White
2005–2015
63
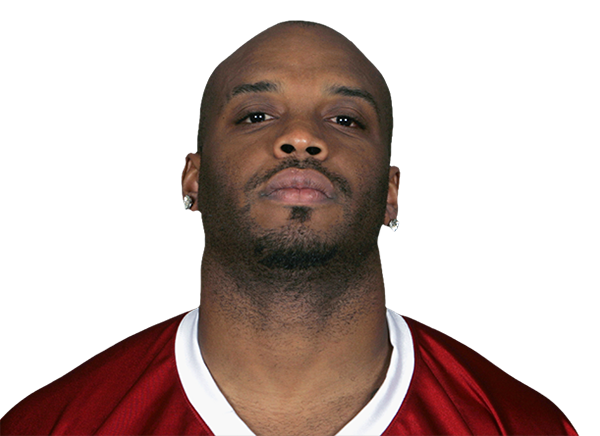
John Abraham
2006–2012
68.5
Jeffrey Scott Case
1985–1994
30
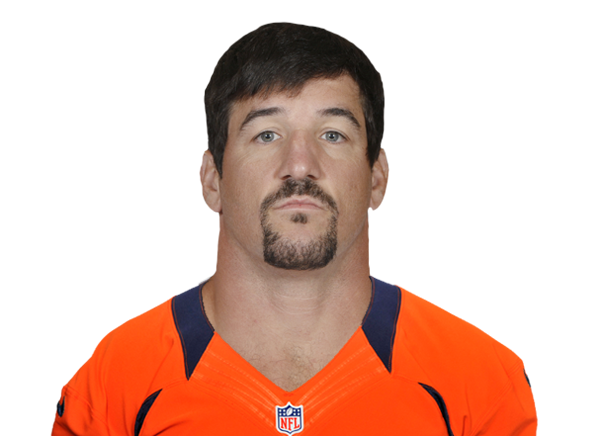
Keith Brooking
1998–2008
1,127
Totals are regular-season stats while with this franchise, built from ESPN records (full statistical coverage from 1986 onward). Players whose careers ended before that may be missing.