Vikings
7-2

49ers
8-1
GameLens favors SF at 61%, with no meaningful edge against the current line.
Full analysisLow confidence (33/100) from 9 games of data per team. Late injury news and line movement before kickoff aren't reflected until the next refresh.
Pregame model pick
Not saved yetSF 60.6%
This pick has not been saved yet. Upcoming games are saved when the slate is viewed and once a day.
Graded on the last pregame save: the winner pick and win probability as saved, and the spread pick against the opening spread recorded in that save. Updates after kickoff are impossible, so the graded snapshot is the one shown as locked.
The biggest drivers of the projection, in points and win probability.
SF +0.30 vs MIN -0.33 EPA/dropback (vs. league avg)
SF -0.05 vs MIN -0.44 EPA/dropback allowed (vs. league avg)
SF +0.30 vs MIN +0.04 EPA/rush (vs. league avg)
The biggest unit-vs-unit advantages, from each side's season-to-date play.
SF big-play defense vs MIN explosive plays
SF run defense vs MIN run game
MIN pass rush vs SF offensive line
Change assumptions and GameLens recalculates the win probability. Player values are estimated points per game above a replacement-level player.
Change a player, efficiency or weather assumption to recalculate.
The in-game chart starts at kickoff. Until then, the pregame model's number above is the only probability.
Touchdowns, big plays, defensive plays and clutch moments.
How Stephen A. is looking at Vikings-49ers matchup
Can the Vikings make a Super Bowl run with Kirk Cousins?
The model's highest hit-probability props in this matchup, tracked live. Click one for the full breakdown.
The spread pick is graded against the opening spread recorded in the last pregame save. The feed doesn't timestamp line moves, so “fetched” is when this page last pulled the market, not when the line moved.
Opening line SF -3.5, weighted 31% while the sample is 9 games
SF +9.4 vs MIN +5.6 per game
SF +0.04 vs MIN +0.05 EPA/rush allowed (vs. league avg)
SF win probability
Market probability comes from the moneyline with the sportsbook margin removed. This comparison is for analysis only. It is not betting advice.
SF explosive plays vs MIN big-play defense
SF red-zone defense vs MIN red-zone offense
Your Week 11 Pick'em
One team per week. Graded when the game goes final.
0-0
Season
5 of 5 lines
| Details | |||||||
|---|---|---|---|---|---|---|---|
JW 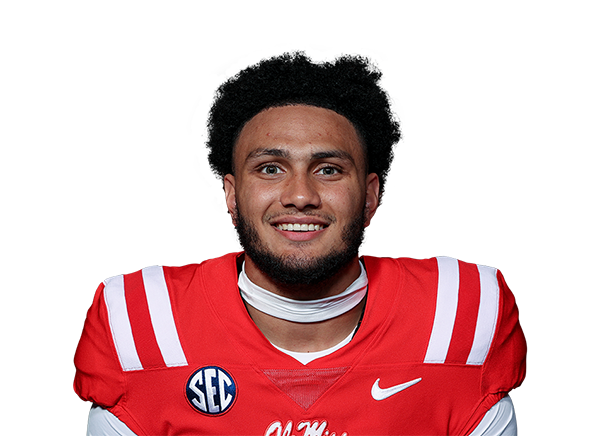 | Receiving Yards | O 6.5(-2.0 from open) | 25 | 63%at cap | +10.6%Assumes −110 | Pregame · 5g sample | |
KA 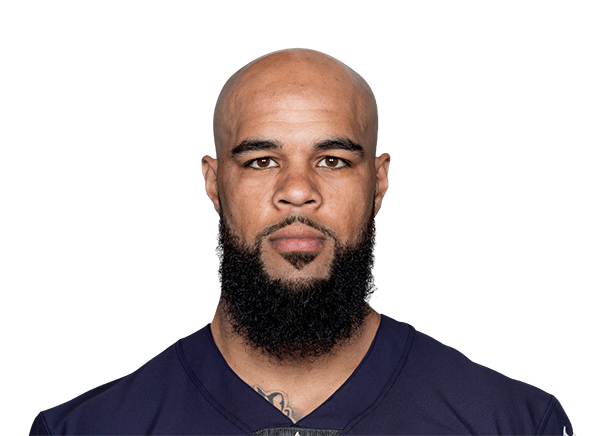 | Receptions | O 2.5 | 3.8 | 63%at cap | +10.6%Assumes −110 | Pregame · 9g sample | |
JW | Receptions | O 0.5 | 1.2 | 63%at cap | +10.6%Assumes −110 | Pregame · 5g sample | |
AJ 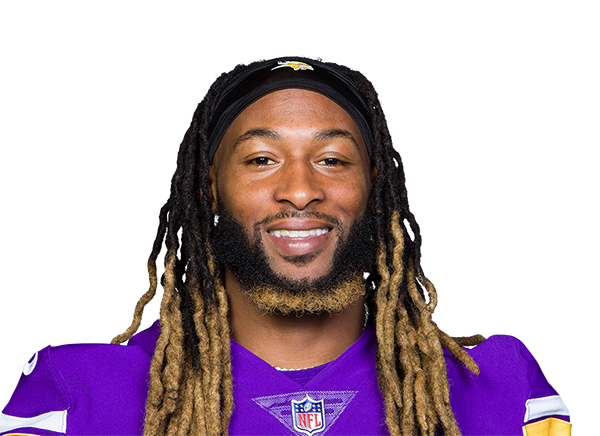 | Carries | O 8.5 | 11.4 | 62% | +9.2%Assumes −110 | Pregame · 9g sample | |
AJ | Rushing Yards | O 31.5 | 45.5 | 61% | +8.9%Assumes −110 | Pregame · 9g sample |
Built from the model's strongest moneyline and prop legs in this game. Toggle legs to reprice the slip.