
Offense
596 plays · 9 games
- BalancedNeutral early-down pass rate of 49%, right around league average.
- Vertical passing22% of throws travel 15+ air yards (league 19%).
- Neutral pass rate
- 49% lg 51%
- Shotgun rate
- 63% lg 61%
- Deep pass rate
- 22% lg 19%

2026 season
5-3-1 · 1st in NFC East · Head coach John Harbaugh · MetLife Stadium
GameLens rank
#21
-4.9 pts (incl. -0.8 injuries)
Off EPA
-0.03
per play
Def EPA
0.00
allowed
NYG rank #21 of 32 in GameLens, -4.9 pts vs. an average team on a neutral field. Identity: balanced.
Full analysisBuilt from 9 games, so one result still moves the rating a lot. The current injury report is costing 0.8 pts, and statuses can change before kickoff. Scheme labels are inferred from play-by-play; coverage and rusher counts aren't charted.
After Week 9 vs. After Week 10 (L 21-24 vs WSH).
Summary: Game grade 45/100 for the L 21-24 vs WSH, ranked against every team-game this season. Rating effect: +0.4 pts (after Week 9 → after Week 10, before injuries). No single factor accounts for most of the change: performance vs. expectation +0.2, recent-game weighting +0.1, opponent adjustment +0.3, sample size -0.1.
Identified from 2026 play-by-play and compared against the league average.
596 plays · 9 games
Where opponents throw against them, and who is credited with sacks and QB hits, across 9 games and 304 opponent dropbacks. Coverage shells and rusher counts aren't in the data, so any coverage label is an inference.
Where opponents throw, how often they complete, and how often the rush records pressure (a sack or QB hit), from 304 opponent dropbacks. Coverage leans below are inferred from these, not charted.
Completion % allowed by zone
3WR 1TE
| # | Player | Pos | Age | Ht | Wt | Exp | College |
|---|---|---|---|---|---|---|---|
| 18 | JM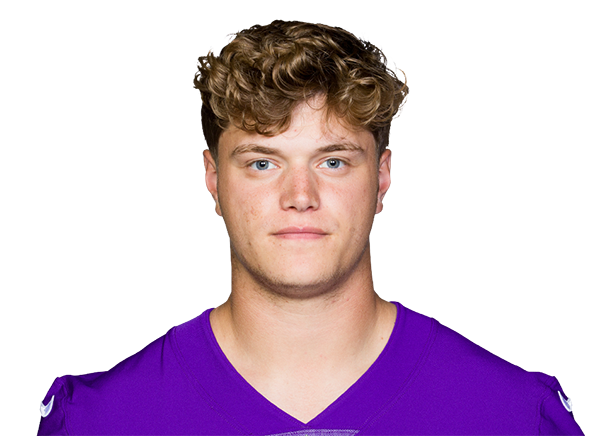 J.J. McCarthy | QB | 23 | 6' 3" | 219 | 3 | Michigan |
| 19 | JW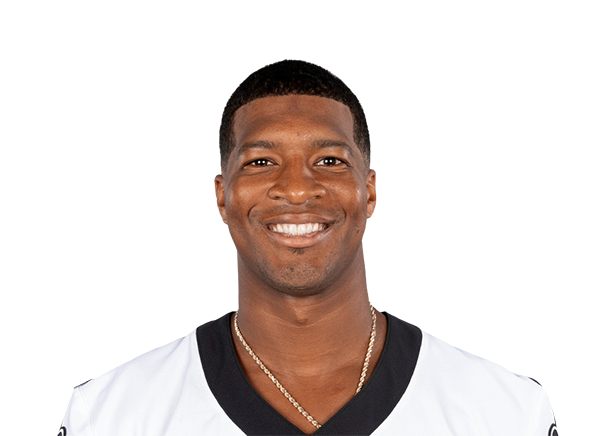 Jameis Winston |
These four parts add up exactly to the total before rounding. "Biggest factor" is shown only when one part moved the same way as the total and makes up at least 60% of the movement.
* Steps don't add up exactly because of rounding. Exact: -5.94 + 1.86 − 0.79 injuries = -4.87. Each number is rounded to one decimal on its own, so −0.1 of this step is rounding.
The team hasn't played since After Week 10, so its own results are unchanged. Its rating still moves because each win or loss is worth more or less as those opponents' ratings update: a game against an opponent who has since looked stronger counts for more.
From today's ESPN injury report (total -0.8 pts). ESPN doesn't publish past reports, so this shows current status rather than a week-over-week change.
Each cell: completion %, yards per attempt and attempts (n). Green is at least 5 points below the league completion rate for that zone, red at least 5 above. Cells with fewer than 5 attempts stay neutral.
Defenders named in pass-play descriptions
Attribution: the first defender named in parentheses after the receiver in ESPN's play text. That is usually the tackler on a catch or the defender credited on an incompletion, not a charted coverage assignment. Only throws with a charted depth count, and defenders need at least 4 such targets.
| Defender | Tgts | Comp% | Yds/Tgt | TD |
|---|---|---|---|---|
| A.ReeseLeft inside LB | 32 | 91% | 5.5 | 0 |
| G.NewsomeRight corner | 26 | 77% | 9.7 | 0 |
| D.BanksLeft corner | 22 | 59% | 5.3 | 0 |
| A.PhillipsUnlisted | 18 | 89% | 9.6 | 0 |
| T.EdmundsRight inside LB | 18 | 89% | 6.9 | 0 |
| A.WashingtonStrong safety | 18 | 78% | 6.4 | 0 |
Recorded pressure means a sack or QB hit. Each one is tied to the rusher's spot on the "Base 3-4 D" depth chart. Pressure credited to a linebacker or defensive back is treated as a likely blitz.
Recorded pressure
13%
40 of 304 drops · lg 17%
LB/DB pressure share
28%
11 of 40 pressures
Sacks
18
6% of 304 drops
Recorded pressure counts only sacks and QB hits; hurries are not in the play-by-play. LB/DB pressure share is a blitz proxy, not a blitz rate: it only sees blitzes that got home.
Where the pressure comes from
When they bring it
| Situation | Drops | Pressure vs league | LB/DB pressure |
|---|---|---|---|
| 1st down | 97 | 9% / 14% | 0% |
| 2nd down | 114 | 12% / 14% | 4% |
| 3rd & short (1-3) | 11 | 9% / 18% | 0% |
| 3rd & medium (4-6) | 26 |
Top blitzers
549 plays · 9 games
Base 3-4 D
| QB |
| 32 |
| 6' 4" |
| 231 |
| 12 |
| Florida State |
| 26 | DS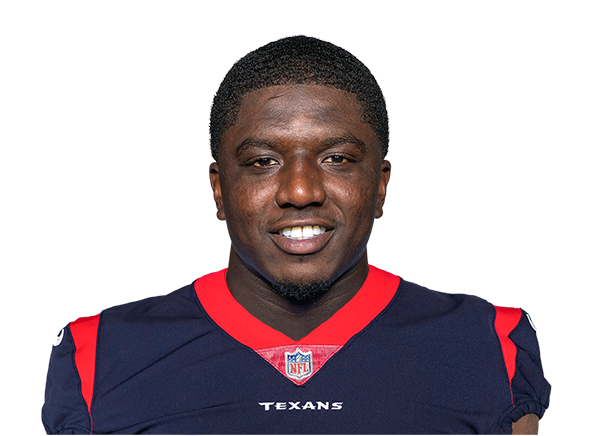 Devin Singletary | RB | 29 | 5' 7" | 203 | 8 | Florida Atlantic |
|---|
| 29 | TT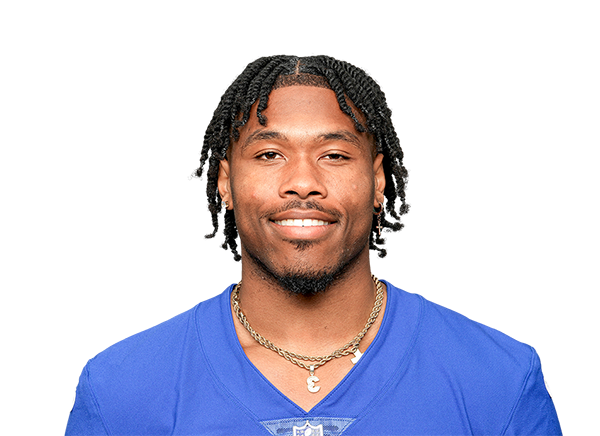 Tyrone Tracy Jr.Injured Reserve | RB | 26 | 5' 11" | 210 | 3 | Purdue |
|---|
| 30 | GD Greg Desrosiers Jr.Out | RB | 25 | 5' 11" | 200 | R | Memphis |
|---|
| 36 | PM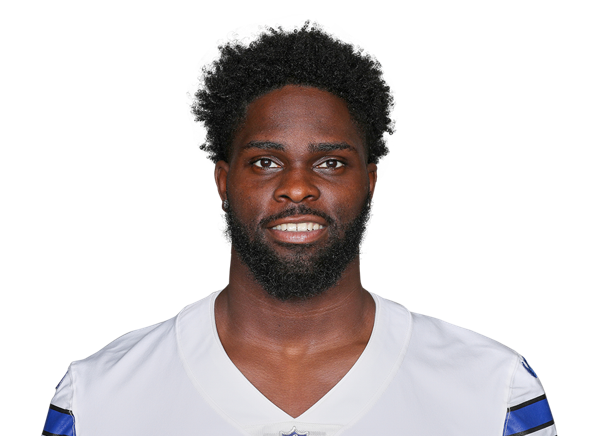 Phil Mafah | RB | 24 | 6' 1" | 232 | 1 | Clemson |
|---|
| 44 | CS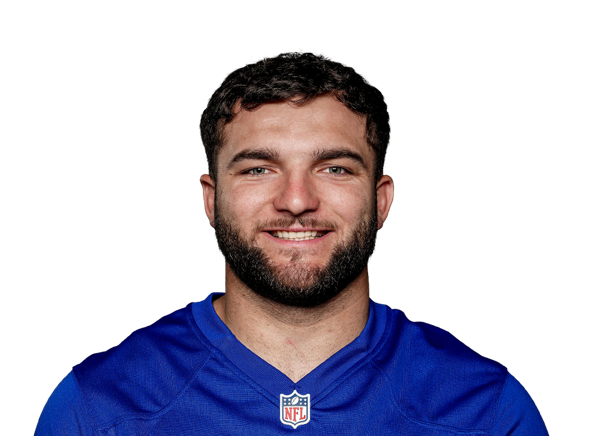 Cam Skattebo | RB | 24 | 5' 11" | 215 | 2 | Arizona State |
|---|
| 45 | PR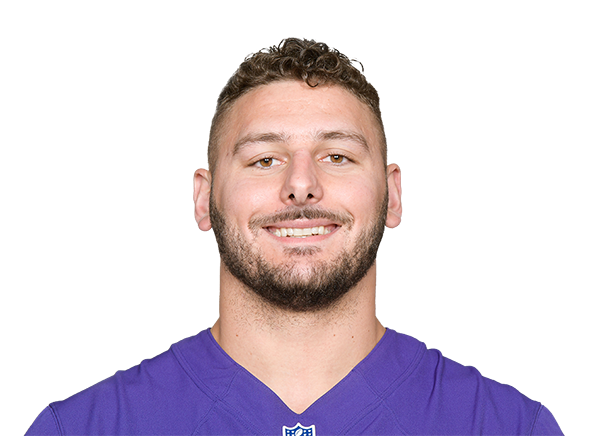 Patrick Ricard | FB | 32 | 6' 3" | 300 | 10 | Maine |
|---|
| 1 | MN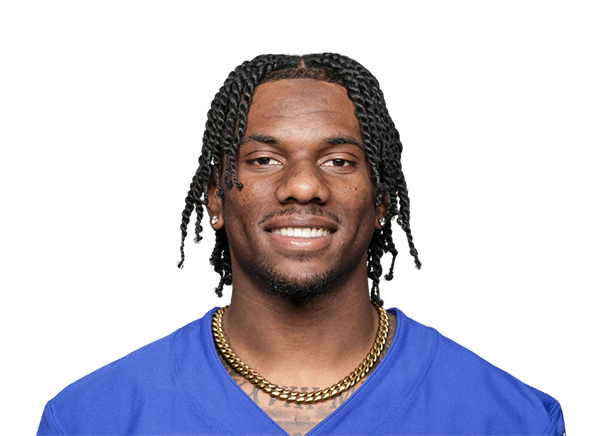 Malik Nabers | WR | 23 | 6' 0" | 200 | 3 | LSU |
|---|
| 17 | DM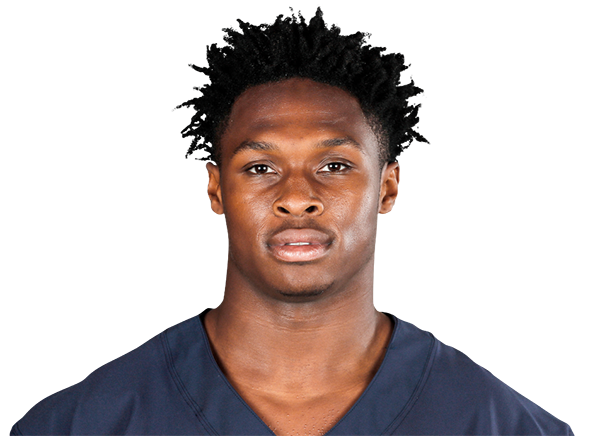 Darnell Mooney | WR | 29 | 5' 11" | 177 | 7 | Tulane |
|---|
| 80 | XG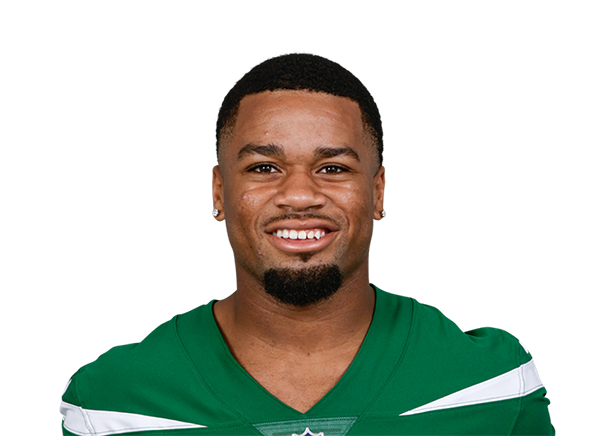 Xavier Gipson | WR | 25 | 5' 9" | 189 | 4 | Stephen F. Austin |
|---|
| 81 | JH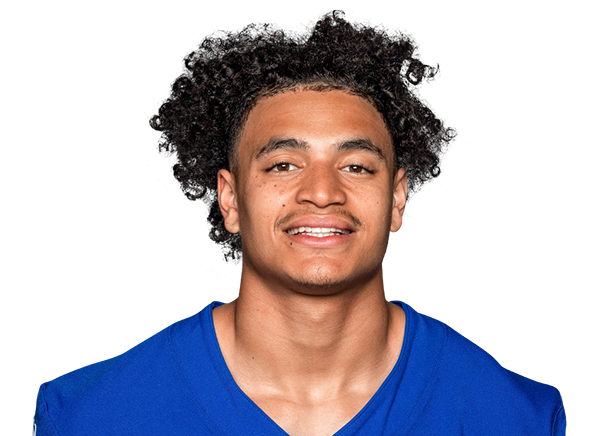 Jalin Hyatt | WR | 25 | 6' 0" | 185 | 4 | Tennessee |
|---|
| 83 | DC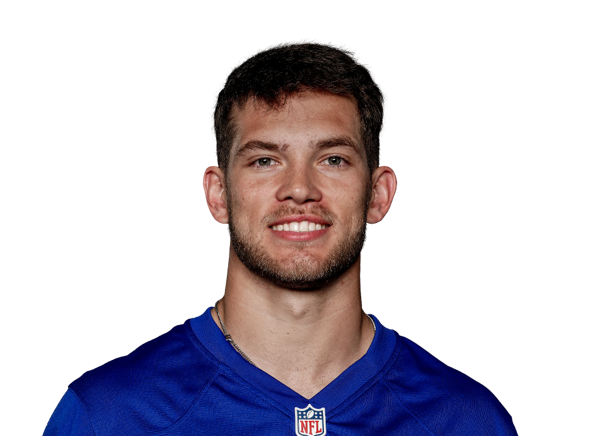 Dalen Cambre | WR | 25 | 6' 0" | 192 | 2 | Louisiana |
|---|
| 88 | MF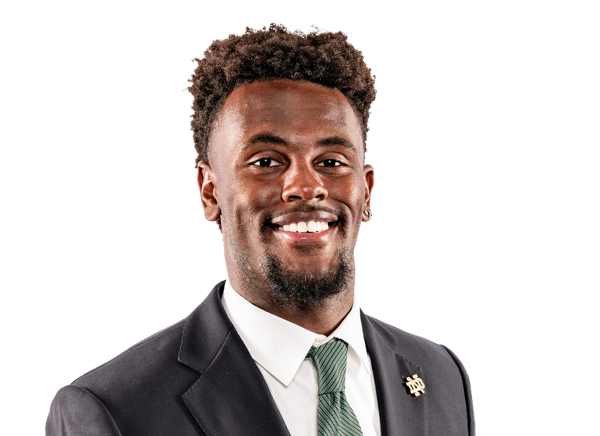 Malachi Fields | WR | 23 | 6' 4" | 222 | R | Notre Dame |
|---|
| 9 | IL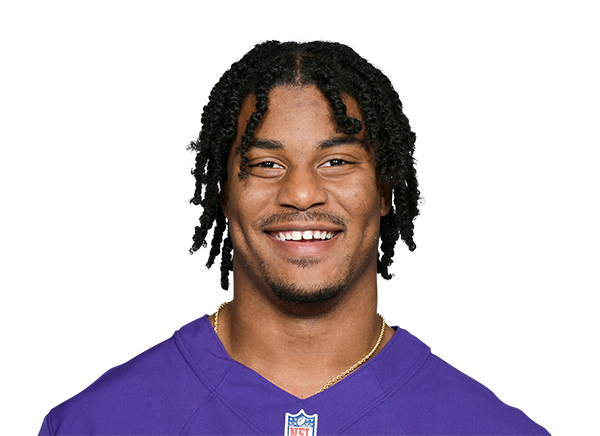 Isaiah Likely | TE | 26 | 6' 4" | 241 | 5 | Coastal Carolina |
|---|
| 84 | TJ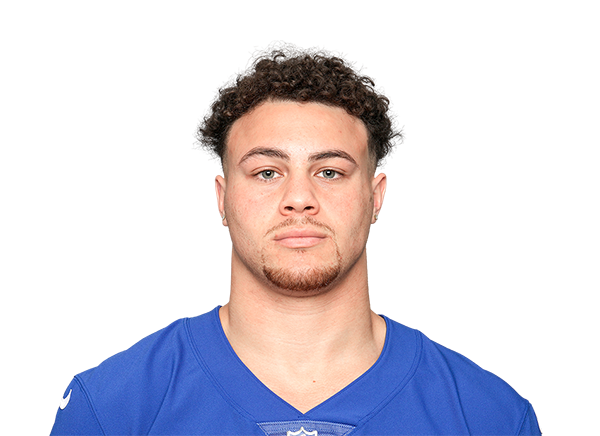 Theo Johnson | TE | 25 | 6' 6" | 264 | 3 | Penn State |
|---|
| 85 | CM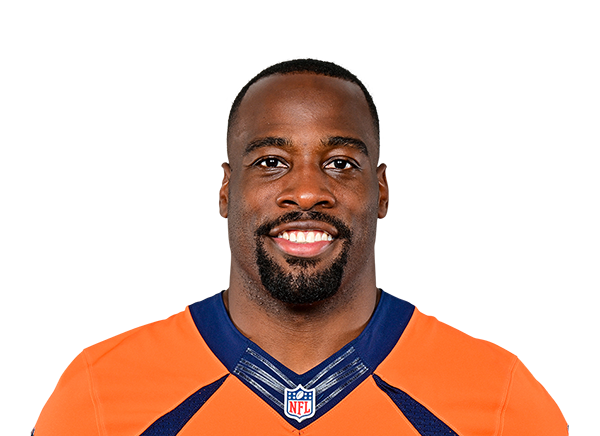 Chris Manhertz | TE | 34 | 6' 6" | 235 | 11 | Canisius |
|---|
| 86 | TF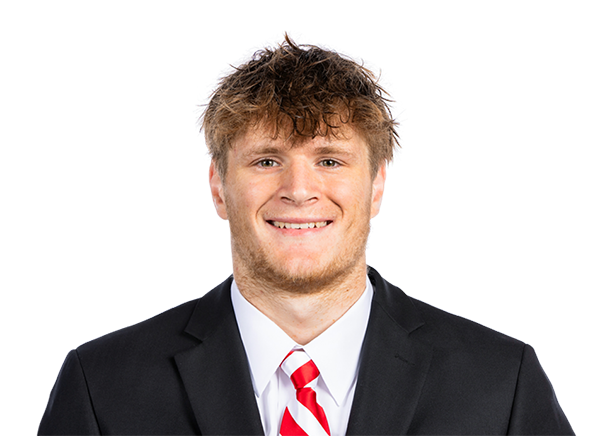 Thomas Fidone IIOut | TE | 24 | 6' 6" | 255 | 2 | Nebraska |
|---|
| 71 | MM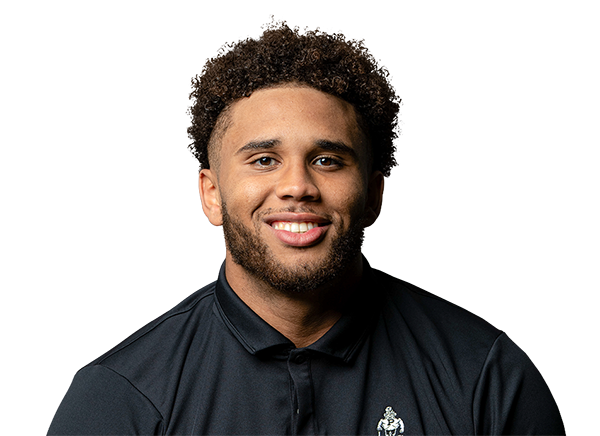 Marcus Mbow | OT | 23 | 6' 5" | 300 | 2 | Purdue |
|---|
| 72 | JE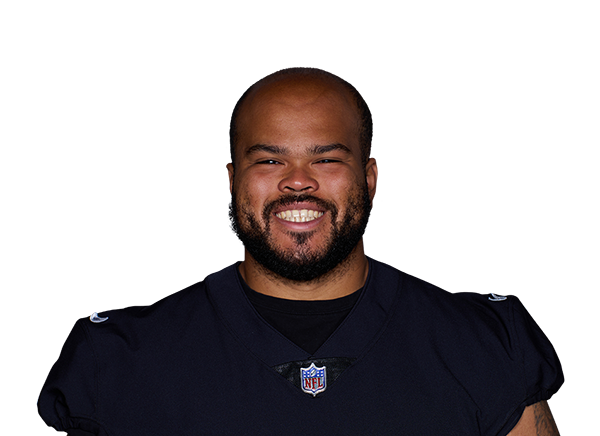 Jermaine Eluemunor | OT | 31 | 6' 4" | 338 | 10 | Texas A&M |
|---|
| 74 | JD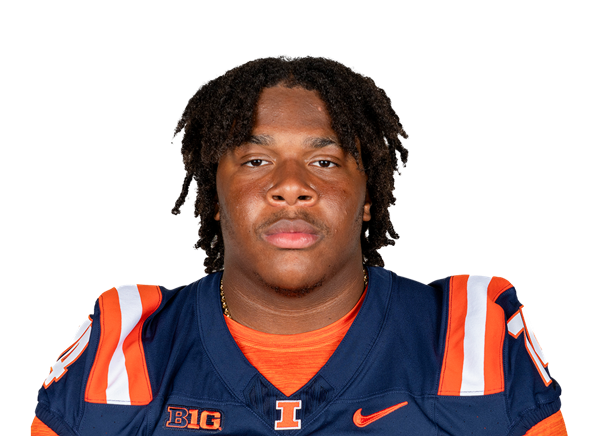 J.C. DavisOut | OT | 23 | 6' 4" | 322 | R | Illinois |
|---|
| 78 | AT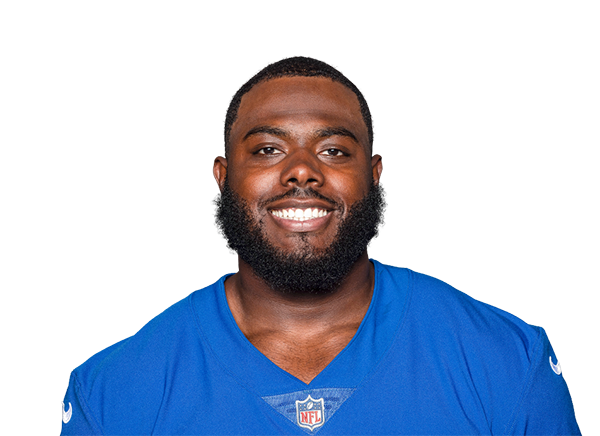 Andrew Thomas | OT | 27 | 6' 5" | 315 | 7 | Georgia |
|---|
| 64 | AS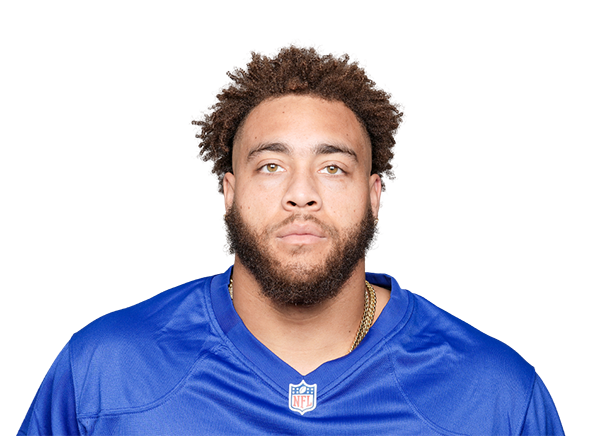 Aaron Stinnie | G | 32 | 6' 3" | 312 | 9 | James Madison |
|---|
| 67 | JS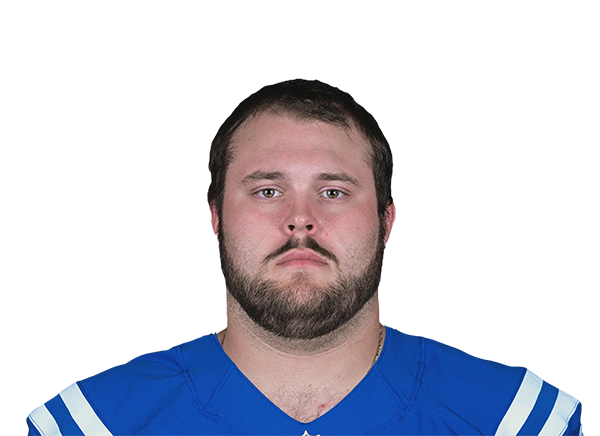 Josh SillsOut | G | 27 | 6' 6" | 325 | 3 | Oklahoma State |
|---|
| 76 | JR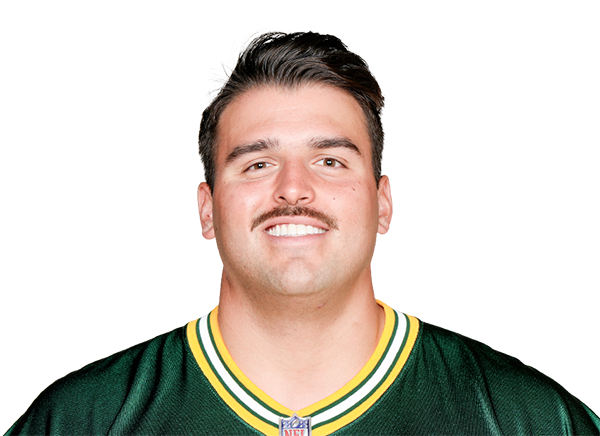 Jon Runyan | G | 29 | 6' 4" | 307 | 7 | Michigan |
|---|
| 60 | BH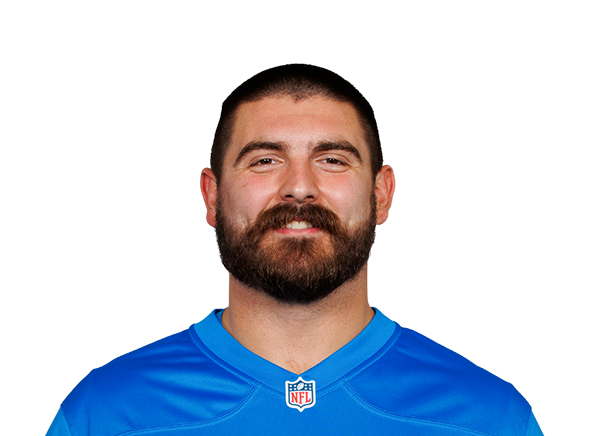 Bryan Hudson | C | 25 | 6' 5" | 305 | 1 | Louisville |
|---|
| 61 | JM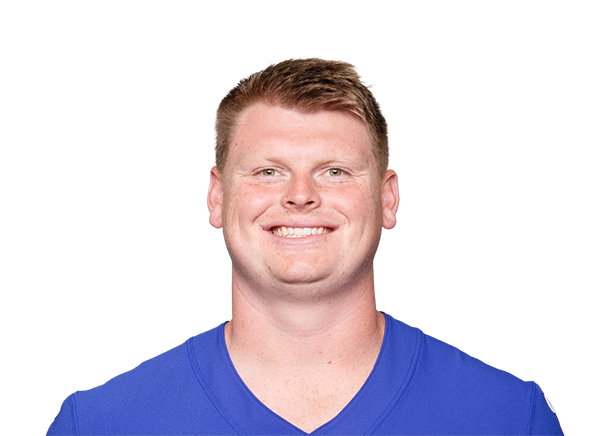 John Michael Schmitz Jr. | C | 27 | 6' 4" | 320 | 4 | Minnesota |
|---|
| # | Player | Pos | Age | Ht | Wt | Exp | College |
|---|---|---|---|---|---|---|---|
| 91 | DA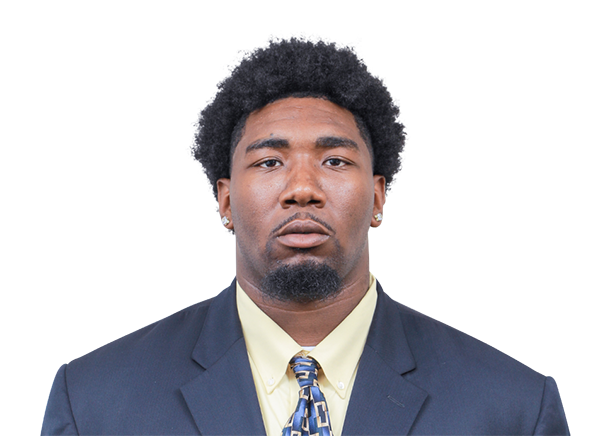 Darius AlexanderOut | DT | 26 | 6' 4" | 310 | 2 | Toledo |
| 93 | SH Shelby Harris | DT | 35 | 6' 2" | 288 | 12 | Illinois State |
| 97 | BJ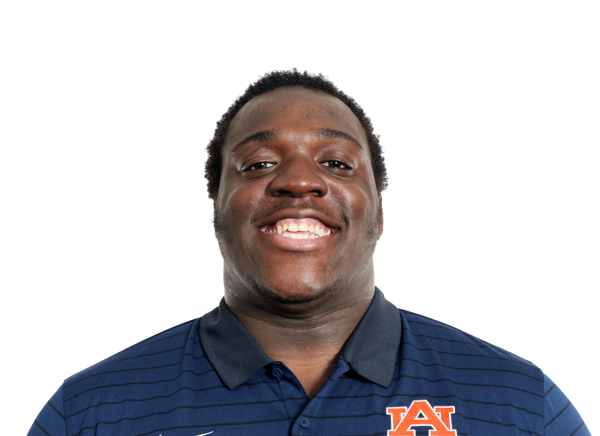 Bobby Jamison-Travis | DT | 25 | 6' 3" | 328 | R | Auburn |
| 98 | DR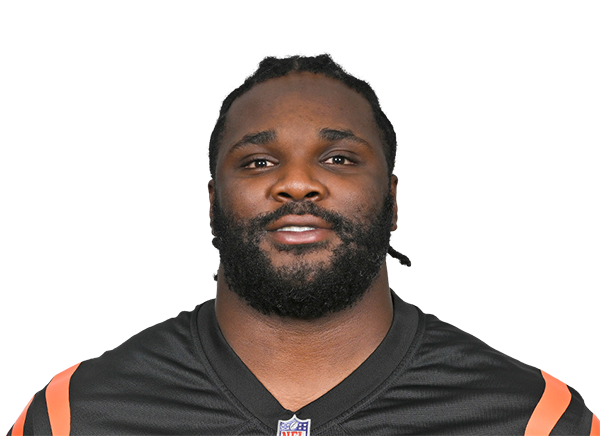 DJ Reader | DT | 32 | 6' 3" | 335 | 11 | Clemson |
| 99 | CO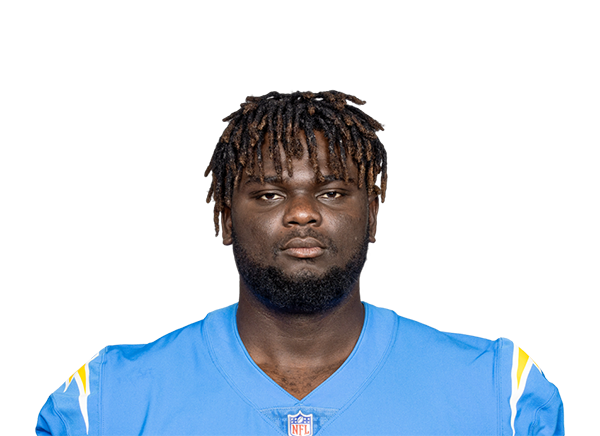 CJ Okoye | DT | 25 | 6' 6" | 370 | 2 | — |
| 3 | AC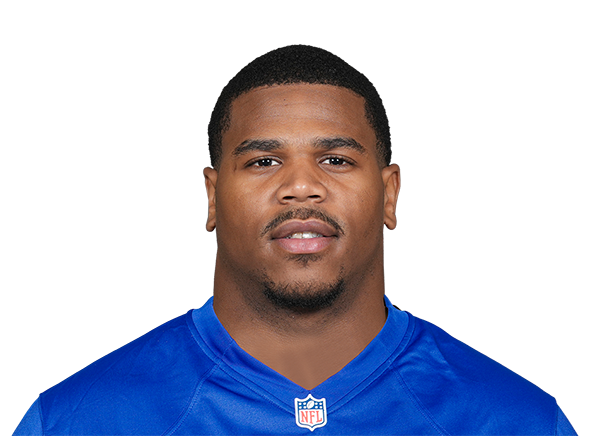 Abdul Carter | LB | 23 | 6' 3" | 252 | 2 | Penn State |
| 5 | KT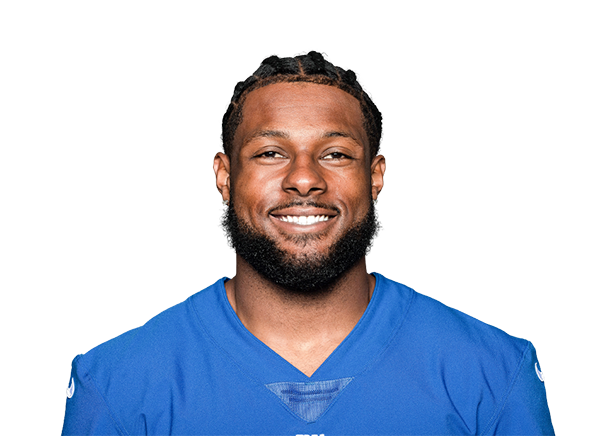 Kayvon Thibodeaux | LB | 25 | 6' 5" | 258 | 5 | Oregon |
| 41 | MM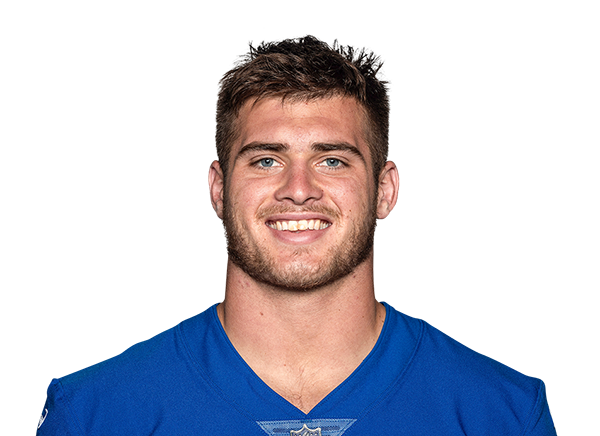 Micah McFadden | LB | 26 | 6' 2" | 232 | 5 | Indiana |
| 46 | ZB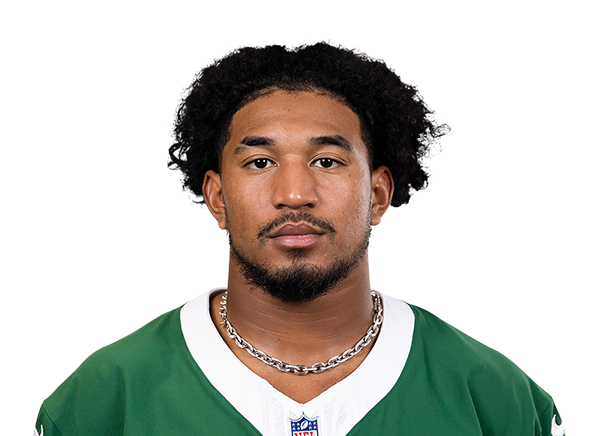 Zaire Barnes | LB | 27 | 6' 1" | 232 | 4 | Western Michigan |
| 48 | TF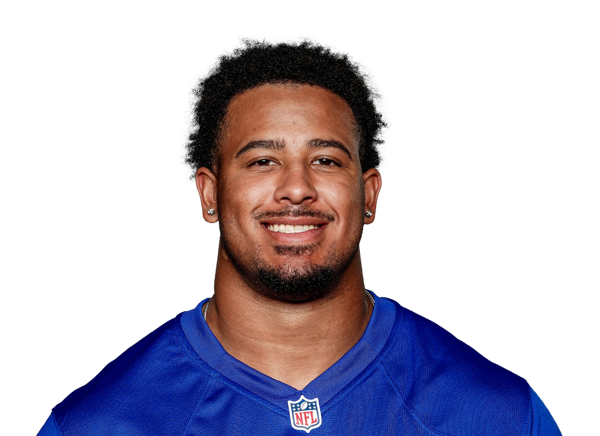 Trace Ford | LB | 25 | 6' 2" | 252 | 1 | Oklahoma |
| 51 | JK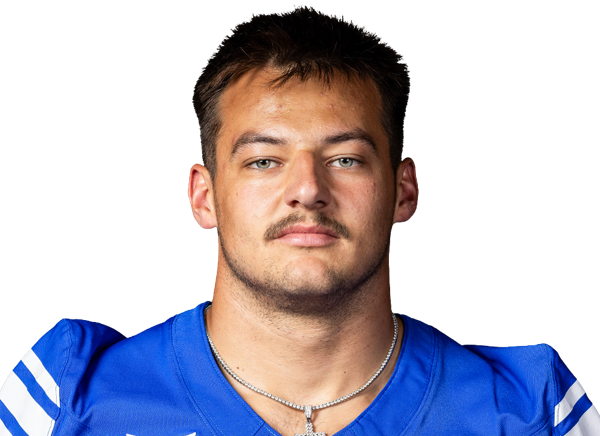 Jack Kelly | LB | 23 | 6' 1" | 240 | R | BYU |
| 52 | AR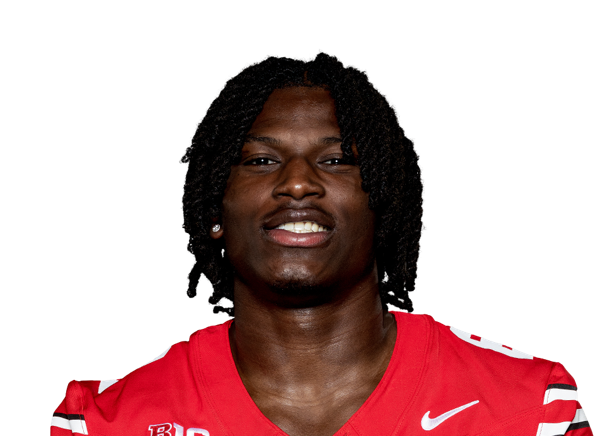 Arvell Reese | LB | 21 | 6' 4" | 243 | R | Ohio State |
| 54 | MH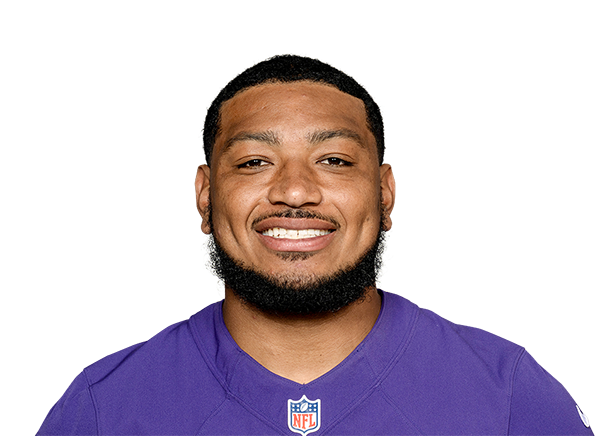 Malik Harrison | LB | 28 | 6' 3" | 247 | 7 | Ohio State |
| 96 | DS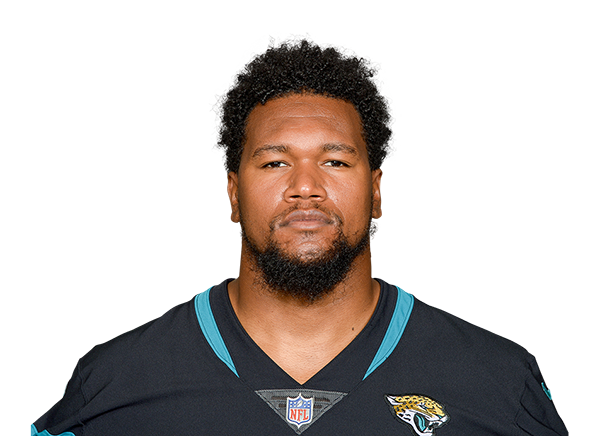 Dawuane Smoot | LB | 31 | 6' 3" | 264 | 10 | Illinois |
| 2 | DB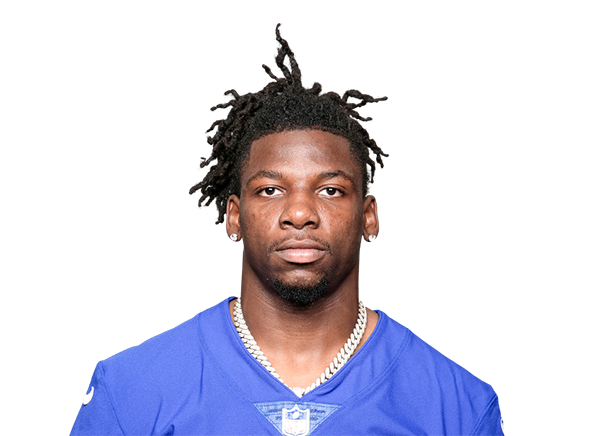 Deonte Banks | CB | 25 | 6' 2" | 200 | 4 | Maryland |
| 12 | CH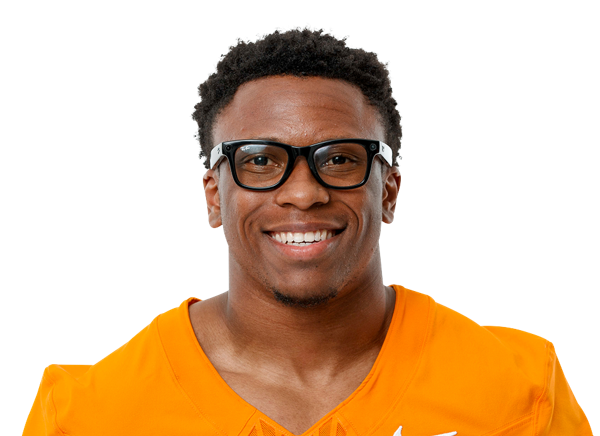 Colton Hood | CB | 21 | 6' 0" | 195 | R | Tennessee |
| 20 | GN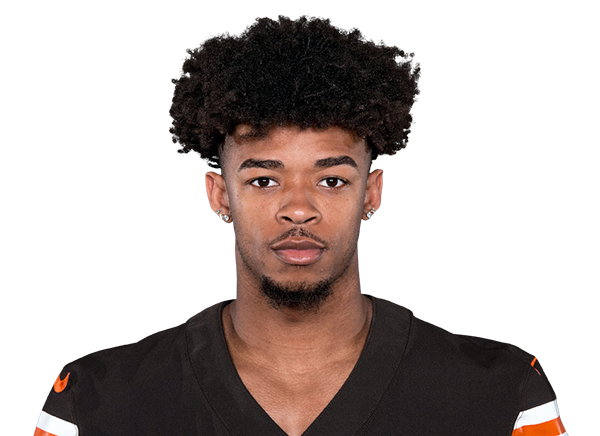 Greg Newsome IIQuestionable | CB | 26 | 6' 0" | 192 | 6 | Northwestern |
| 22 | DP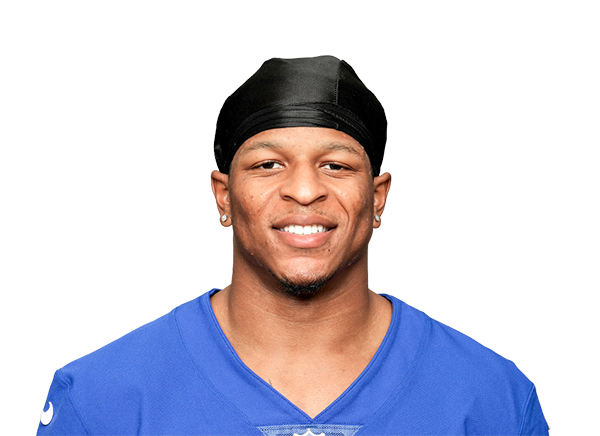 Dru Phillips | CB | 24 | 5' 11" | 180 | 3 | Kentucky |
| 31 | NJ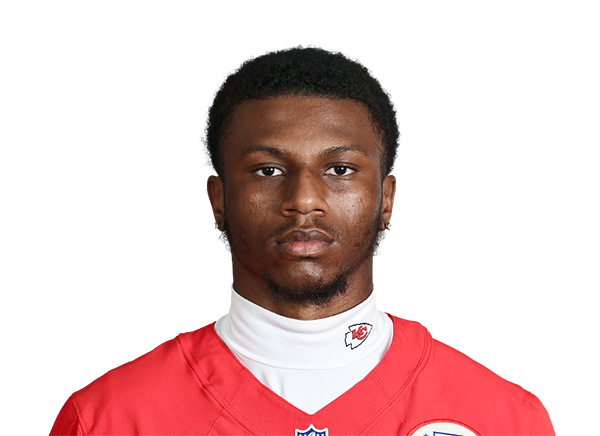 Nic JonesOut | CB | 25 | 6' 0" | 189 | 3 | Ball State |
| 8 | JH Jevon Holland | S | 26 | 6' 1" | 207 | 6 | Oregon |
| 24 | AW Ar'Darius Washington | S | 27 | 5' 8" | 180 | 5 | TCU |
| 25 | JP Jason PinnockOut | S | 27 | 6' 0" | 200 | 6 | Pittsburgh |
| 27 | TN Tyler Nubin | S | 25 | 6' 2" | 210 | 3 | Minnesota |
| 28 | EC Elijah Campbell | S | 31 | 5' 11" | 190 | 6 | Northern Iowa |
| 37 | TT Tavierre Thomas | S | 30 | 5' 10" | 212 | — | Ferris State |
| 43 | RL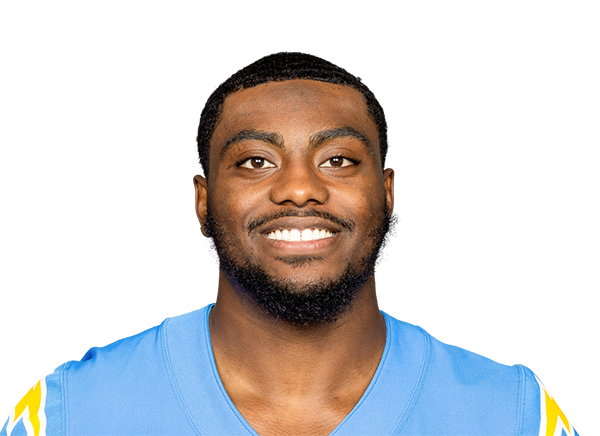 Raheem Layne | S | 27 | 5' 11" | 192 | 3 | Indiana |
| # | Player | Pos | Age | Ht | Wt | Exp | College |
|---|---|---|---|---|---|---|---|
| 34 | DZ Dominic Zvada | PK | 23 | 6' 3" | 187 | R | Michigan |
| 15 | JS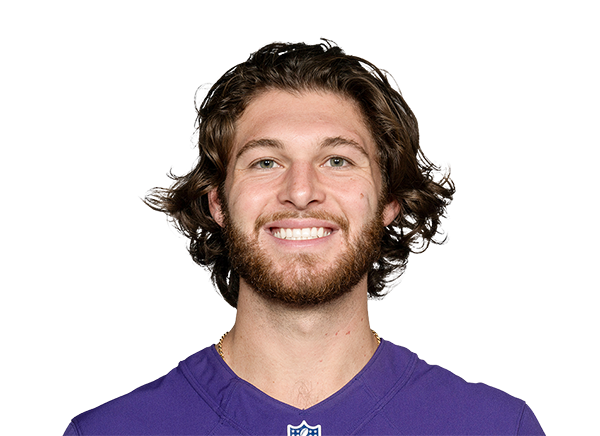 Jordan Stout | P | 28 | 6' 3" | 214 | 5 | Penn State |
| 58 | BM Ben Mann | LS | 24 | 6' 5" | 232 | R | Boston College |
| # | Player | Pos | Age | Ht | Wt | Exp | College |
|---|---|---|---|---|---|---|---|
| 6 | JD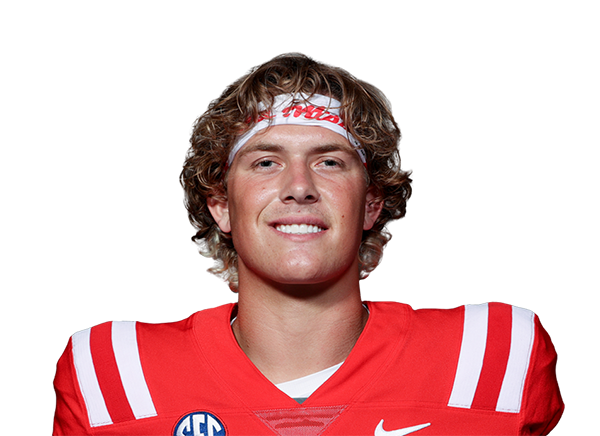 Jaxson DartInjured Reserve | QB | 23 | 6' 2" | 223 | 2 | Ole Miss |
| 80 | GO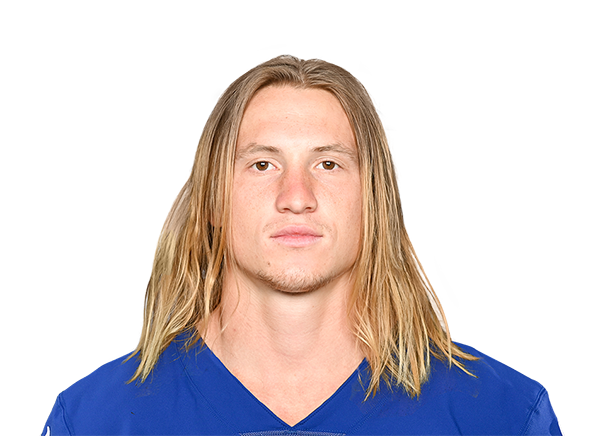 Gunner OlszewskiInjured Reserve | WR | 29 | 6' 0" | 190 | 8 | Bemidji State |
| 82 | CA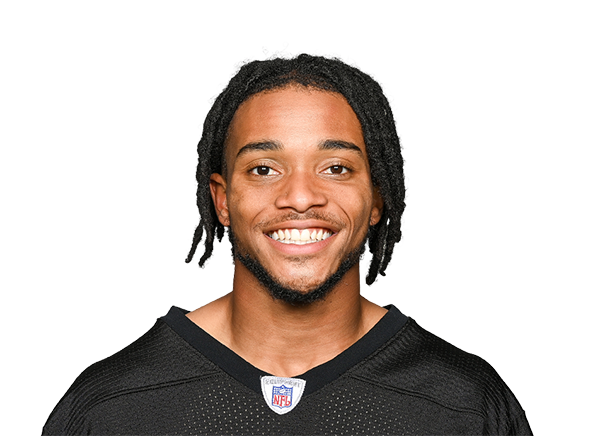 Calvin Austin IIIInjured Reserve | WR | 27 | 5' 9" | 162 | 5 | Memphis |
| 87 | BB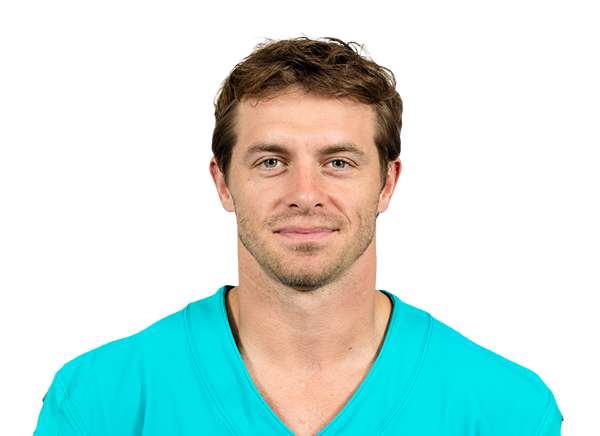 Braxton BerriosInjured Reserve | WR | 31 | 5' 9" | 190 | 9 | Miami |
| 65 | FM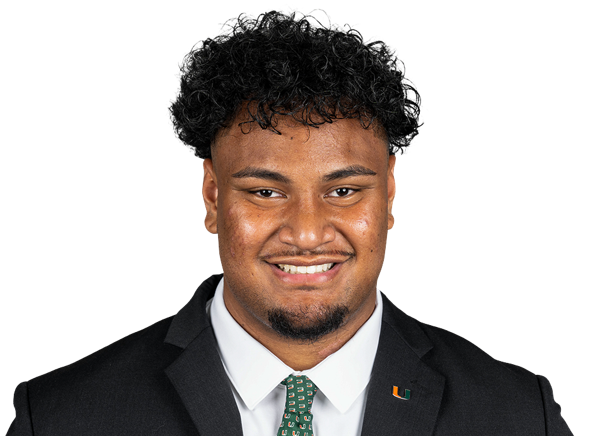 Francis Mauigoa | OT | 21 | 6' 6" | 335 | R | Miami |
| 57 | CG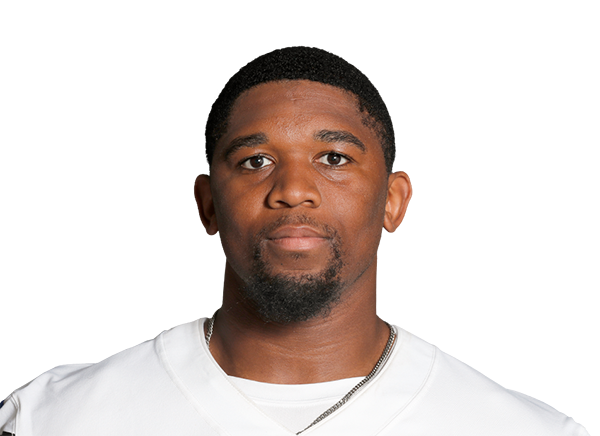 Chauncey GolstonInjured Reserve | DE | 28 | 6' 5" | 277 | 6 | Iowa |
| 95 | RR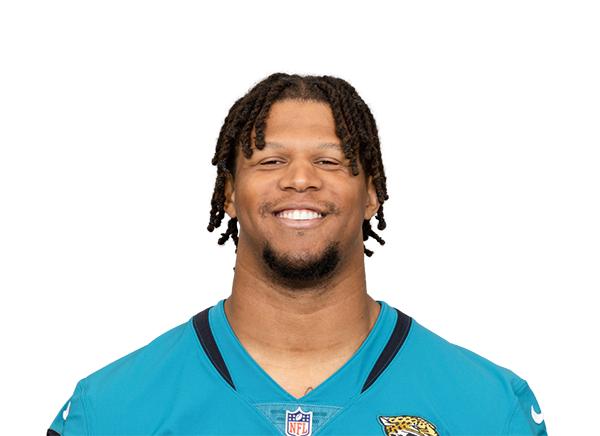 Roy Robertson-HarrisInjured Reserve | DT | 33 | 6' 7" | 300 | 10 | UTEP |
| 0 | BB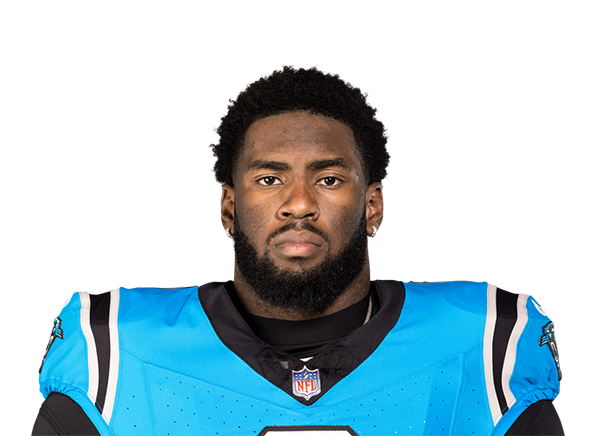 Brian BurnsInjured Reserve | LB | 28 | 6' 5" | 250 | 8 | Florida State |
| 49 | TE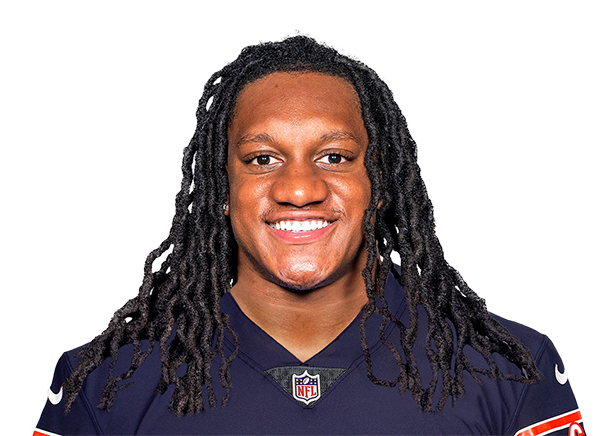 Tremaine EdmundsInjured Reserve | LB | 28 | 6' 4" | 251 | 9 | Virginia Tech |
| 21 | PA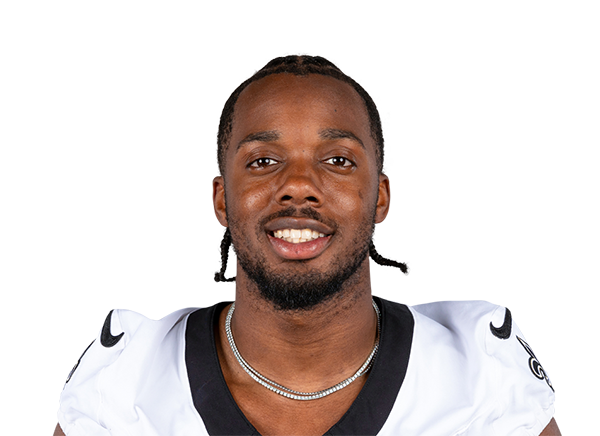 Paulson Adebo | CB | 27 | 6' 1" | 192 | 6 | Stanford |
| 35 | JB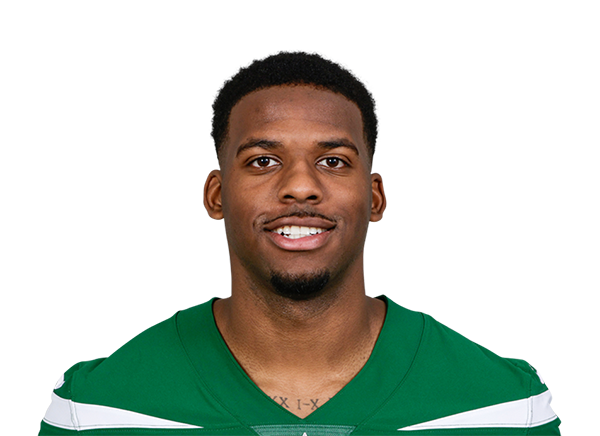 Jarrick Bernard-ConverseInjured Reserve | CB | 26 | 6' 1" | 205 | 4 | LSU |
| 36 | DJ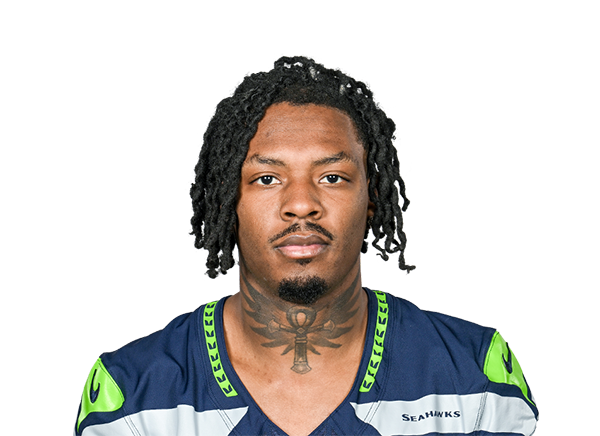 DJ JamesQuestionable | CB | 25 | 6' 0" | 175 | 1 | Auburn |
| 36 | RP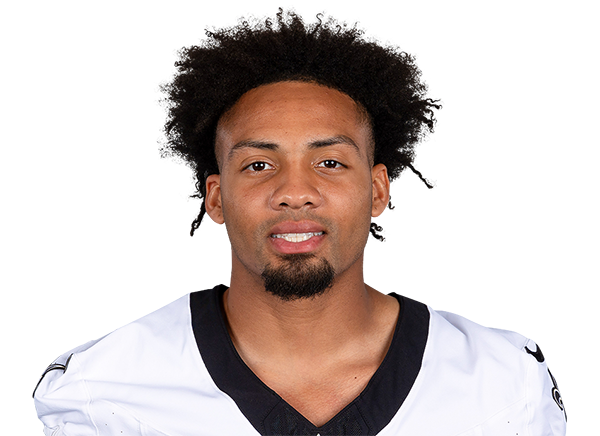 Rico PaytonInjured Reserve | CB | 26 | 6' 0" | 182 | 3 | Pittsburg State |
| 38 | KB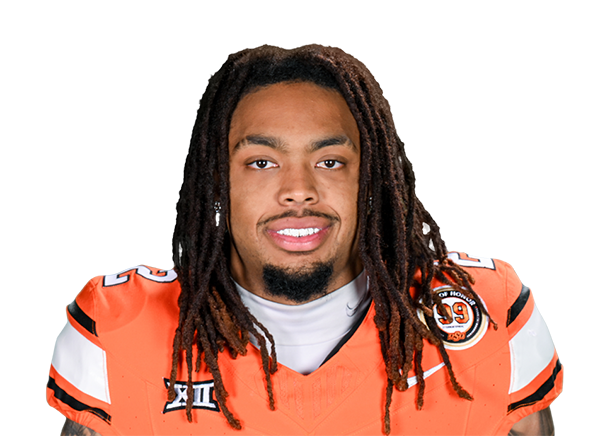 Korie BlackInjured Reserve | CB | 24 | 6' 0" | 190 | 2 | Oklahoma State |
| 39 | TD Thaddeus DixonInjured Reserve | CB | 24 | 6' 1" | 195 | R | North Carolina |
| # | Player | Pos | Age | Ht | Wt | Exp | College |
|---|---|---|---|---|---|---|---|
| 13 | JH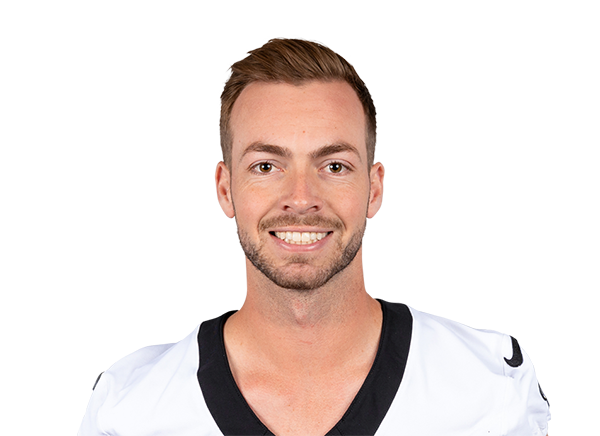 Jake Haener | QB | 27 | 6' 1" | 200 | 3 | Fresno State |
| 20 | EG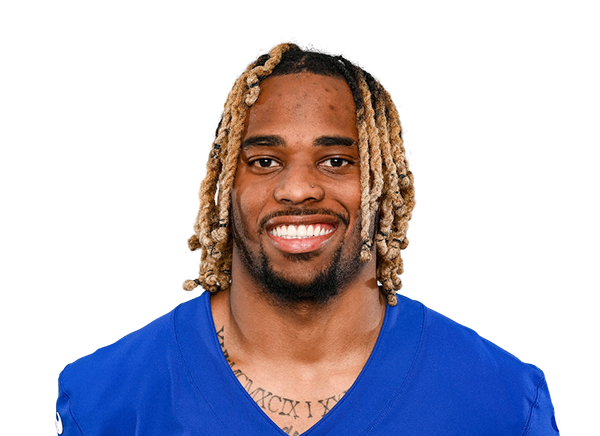 Eric Gray | RB | 27 | 5' 10" | 211 | 4 | Oklahoma |
| 47 | GF Grant Finley | FB | 23 | 6' 4" | 281 | R | Missouri Western |
| 37 | DF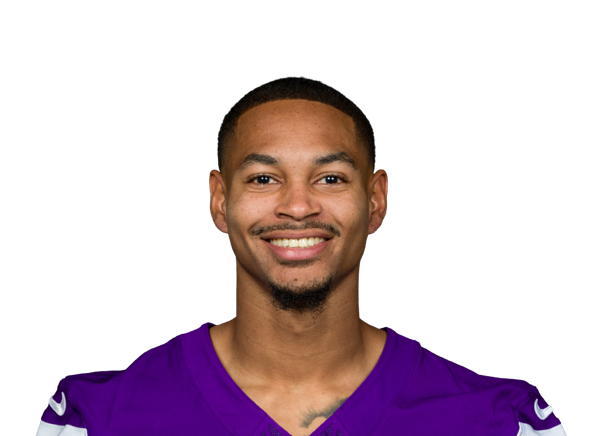 Dontae Fleming | WR | 24 | 6' 2" | 180 | 1 | Tulane |
| 89 | CJ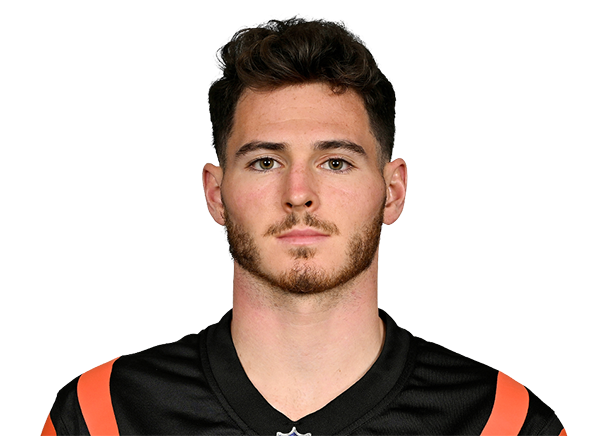 Charlie Jones | WR | 28 | 6' 0" | 190 | 5 | Purdue |
| 70 | RS Ryan Schernecke | OT | 23 | 6' 8" | 330 | R | Kutztown |
| 79 | JG Jarrod Gray | OT | 22 | 6' 7" | 318 | R | — |
| — | JG Josh Gesky | G | 23 | 6' 5" | 308 | R | Illinois |
| — | KG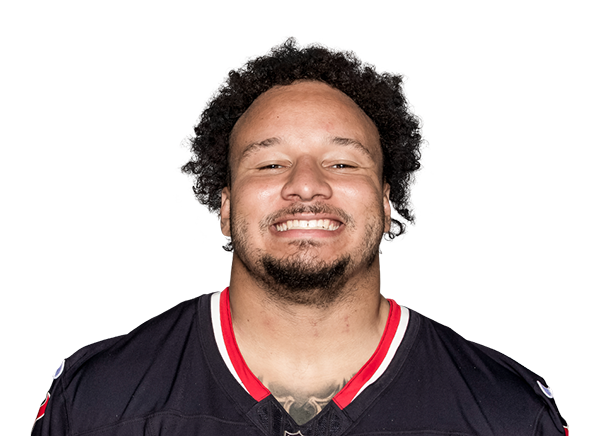 Kendrick Green | C | 27 | 6' 4" | 315 | 5 | Illinois |
| — | CR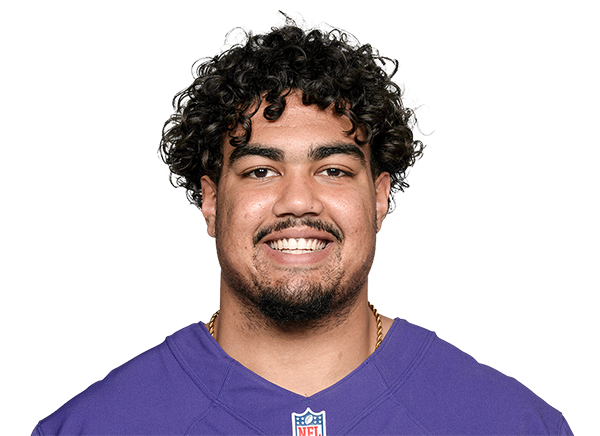 C.J. Ravenell | DE | 26 | 6' 5" | 300 | 2 | Missouri Western |
| 55 | CM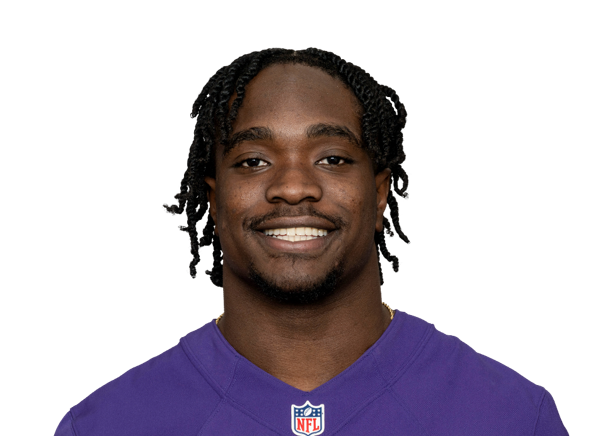 Chandler Martin | LB | 23 | 6' 0" | 230 | 1 | Memphis |
| — | JR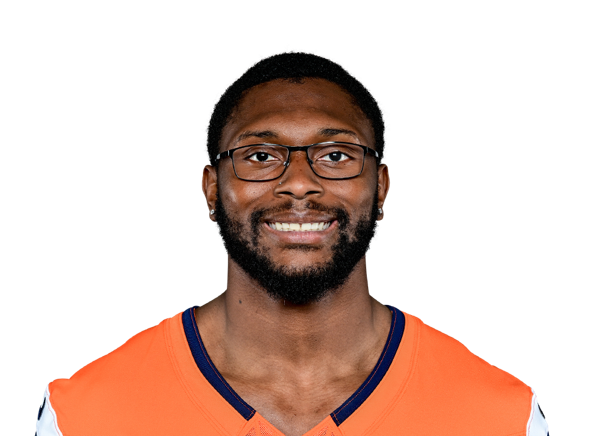 Jaden Robinson | CB | 26 | 6' 0" | 193 | 1 | Oregon State |
| 35 | NR Nikko Reed | CB | 23 | 5' 10" | 180 | 2 | Oregon |
| 8% |
| 3rd & long (7+) | 49 | 24% / 24% | 8% |
| 4th down | 7 | 29% / 22% | 14% |
| Red zone | 35 | 6% / 14% | 3% |
| Two-minute drill | 63 | 17% / 17% | 2% |
The bar shows the team's pressure rate and the tick shows the league rate. LB/DB pressure is the share of dropbacks where a linebacker or DB was credited with a sack or hit. It's a proxy for blitzing, not a true blitz rate: ESPN play-by-play doesn't log rusher counts, so blitzes that don't get home aren't visible.
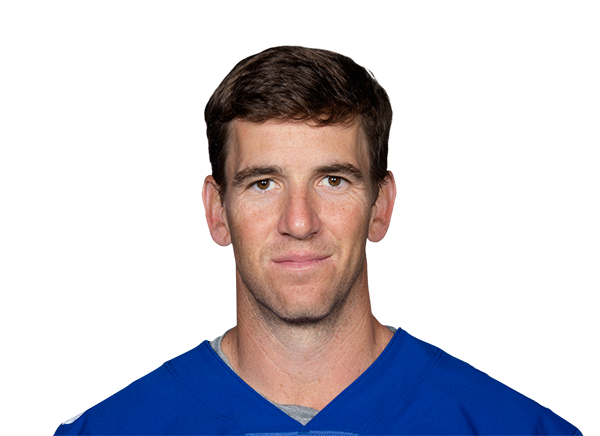
Eli Manning
2004–2019
57,023
Eli Manning
2004–2019
366
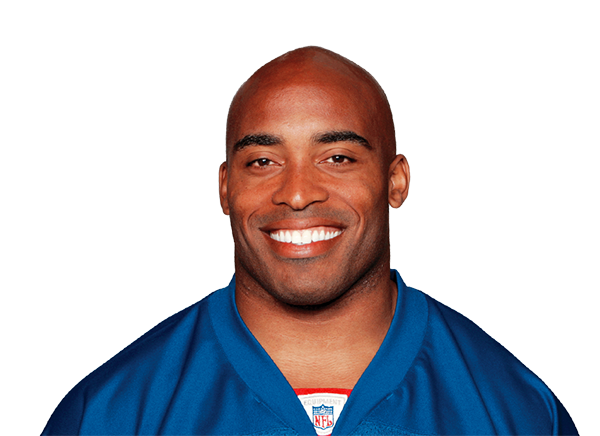
Tiki Barber
1997–2006
10,449
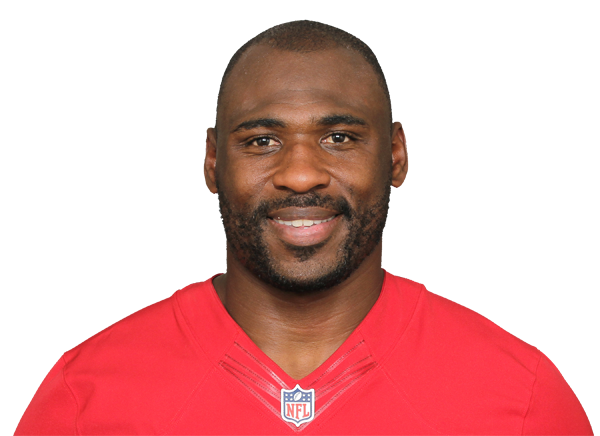
Brandon Jacobs
2005–2013
60
Amani Toomer
1996–2008
668
Amani Toomer
1996–2008
9,497
Amani Toomer
1996–2008
54
Michael Strahan
1993–2007
141.5
Phillippi Sparks
1992–1999
22
Michael Strahan
1993–2007
851
Totals are regular-season stats while with this franchise, built from ESPN records (full statistical coverage from 1979 onward). Players whose careers ended before that may be missing.