
Offense
696 plays · 10 games
- BalancedNeutral early-down pass rate of 51%, right around league average.
- Attacks the middle29% of targets go between the numbers.
- Neutral pass rate
- 51% lg 51%
- Shotgun rate
- 53% lg 61%
- Deep pass rate
- 20% lg 19%

2026 season
8-2 · 5th in National Football Conference · Head coach Ben Johnson · Soldier Field
GameLens rank
#6
+7.4 pts (incl. -1.7 injuries)
Off EPA
+0.05
per play
Def EPA
-0.22
allowed
CHI rank #6 of 32 in GameLens, +7.4 pts vs. an average team on a neutral field. Identity: balanced.
Full analysisBuilt from 10 games, so one result still moves the rating a lot. The current injury report is costing 1.7 pts, and statuses can change before kickoff. Scheme labels are inferred from play-by-play; coverage and rusher counts aren't charted.
After Week 9 vs. After Week 11 (W 21-13 vs NO).
Summary: Game grade 58/100 for the W 21-13 vs NO, ranked against every team-game this season. Rating effect: -1.8 pts (after Week 9 → after Week 11, before injuries). No single factor accounts for most of the change: performance vs. expectation -0.8, recent-game weighting -0.7, opponent adjustment -0.4, sample size +0.2.
Identified from 2026 play-by-play and compared against the league average.
696 plays · 10 games
Where opponents throw against them, and who is credited with sacks and QB hits, across 10 games and 337 opponent dropbacks. Coverage shells and rusher counts aren't in the data, so any coverage label is an inference.
Where opponents throw, how often they complete, and how often the rush records pressure (a sack or QB hit), from 337 opponent dropbacks. Coverage leans below are inferred from these, not charted.
Completion % allowed by zone
3WR 1TE
| # | Player | Pos | Age | Ht | Wt | Exp | College |
|---|---|---|---|---|---|---|---|
| 11 | CK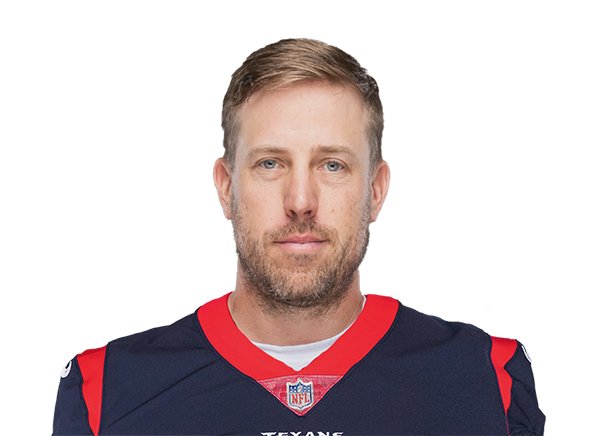 Case KeenumOut | QB | 38 | 6' 1" | 220 | 14 | Houston |
| 16 | MM |
These four parts add up exactly to the total before rounding. "Biggest factor" is shown only when one part moved the same way as the total and makes up at least 60% of the movement.
From today's ESPN injury report (total -1.7 pts). ESPN doesn't publish past reports, so this shows current status rather than a week-over-week change.
Each cell: completion %, yards per attempt and attempts (n). Green is at least 5 points below the league completion rate for that zone, red at least 5 above. Cells with fewer than 5 attempts stay neutral.
Defenders named in pass-play descriptions
Attribution: the first defender named in parentheses after the receiver in ESPN's play text. That is usually the tackler on a catch or the defender credited on an incompletion, not a charted coverage assignment. Only throws with a charted depth count, and defenders need at least 4 such targets.
| Defender | Tgts | Comp% | Yds/Tgt | TD |
|---|---|---|---|---|
| J.JohnsonLeft corner | 26 | 88% | 14.6 | 0 |
| T.StevensonRight corner | 24 | 79% | 10.3 | 0 |
| C.LewisFree safety | 24 | 96% | 9.8 | 0 |
| D.BushWeak-side LB (Will) | 24 | 88% | 7.0 | 0 |
| D.ThienemanStrong safety | 18 | 78% | 11.1 | 0 |
| M.MuhammadRight corner | 16 | 75% | 10.8 | 0 |
Recorded pressure means a sack or QB hit. Each one is tied to the rusher's spot on the "Base 4-3 D" depth chart. Pressure credited to a linebacker or defensive back is treated as a likely blitz.
Recorded pressure
18%
62 of 337 drops · lg 17%
LB/DB pressure share
26%
16 of 62 pressures
Sacks
35
10% of 337 drops
Recorded pressure counts only sacks and QB hits; hurries are not in the play-by-play. LB/DB pressure share is a blitz proxy, not a blitz rate: it only sees blitzes that got home.
Where the pressure comes from
When they bring it
| Situation | Drops | Pressure vs league | LB/DB pressure |
|---|---|---|---|
| 1st down | 126 | 13% / 14% | 2% |
| 2nd down | 105 | 16% / 14% | 4% |
| 3rd & short (1-3) | 16 | 38% / 18% | 6% |
| 3rd & medium (4-6) | 27 |
Top blitzers
545 plays · 10 games
Base 4-3 D
| QB |
| 24 |
| 6' 1" |
| 211 |
| R |
| Louisville |
| 17 | TB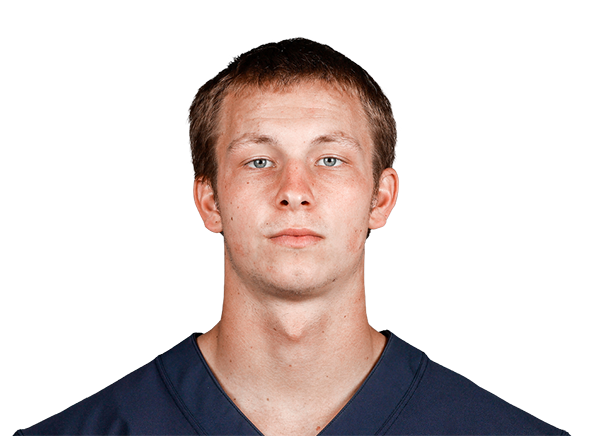 Tyson Bagent | QB | 26 | 6' 3" | 212 | 4 | Shepherd |
|---|
| 18 | CW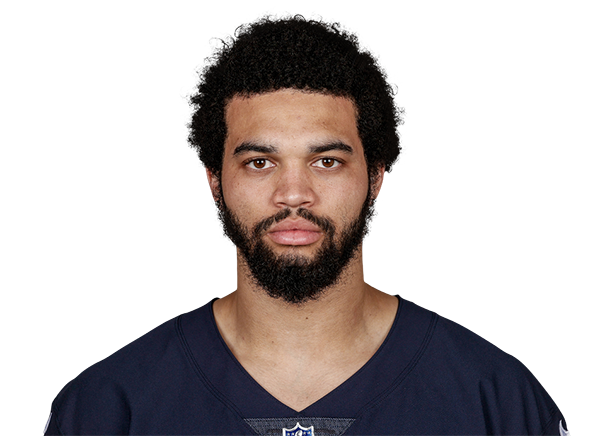 Caleb Williams | QB | 25 | 6' 1" | 226 | 3 | USC |
|---|
| 4 | DS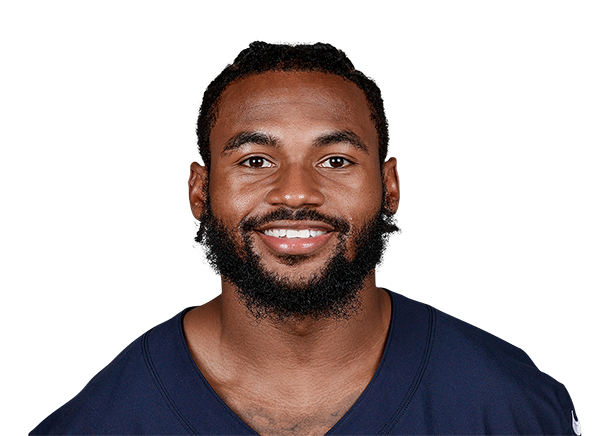 D'Andre Swift | RB | 27 | 5' 8" | 204 | 7 | Georgia |
|---|
| 23 | RJ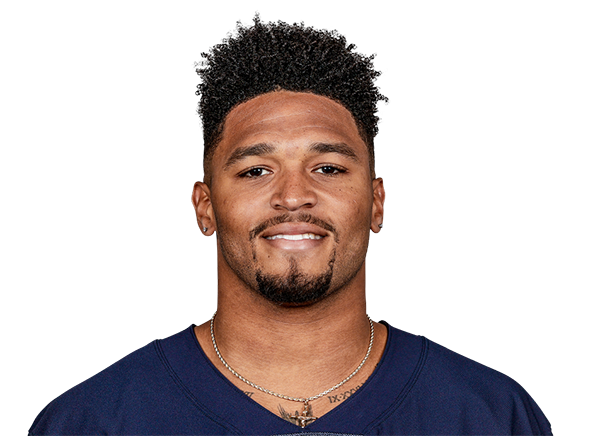 Roschon JohnsonQuestionable | RB | 25 | 6' 0" | 227 | 4 | Texas |
|---|
| 25 | KM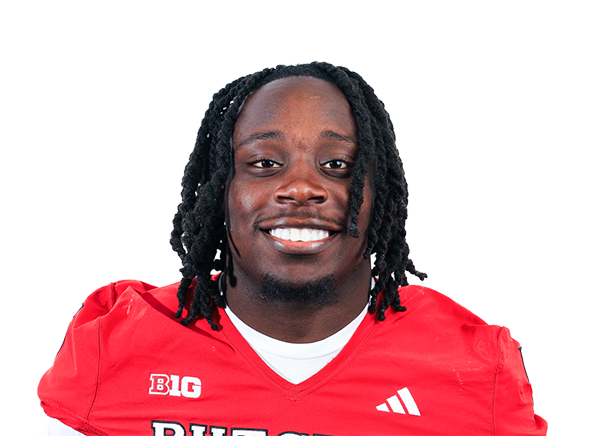 Kyle Monangai | RB | 24 | 5' 8" | 207 | 2 | Rutgers |
|---|
| 36 | SA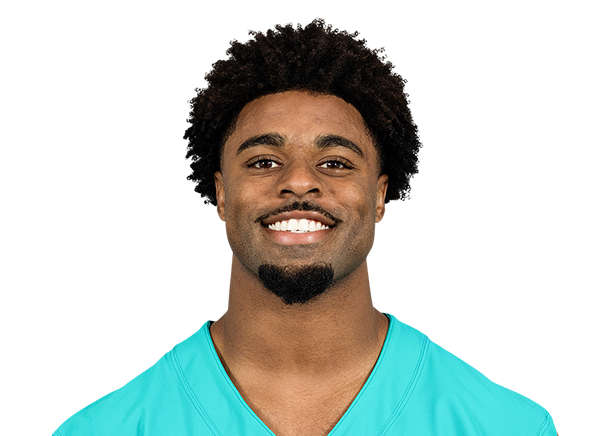 Salvon Ahmed | RB | 27 | 5' 11" | 196 | 5 | Washington |
|---|
| 9 | JW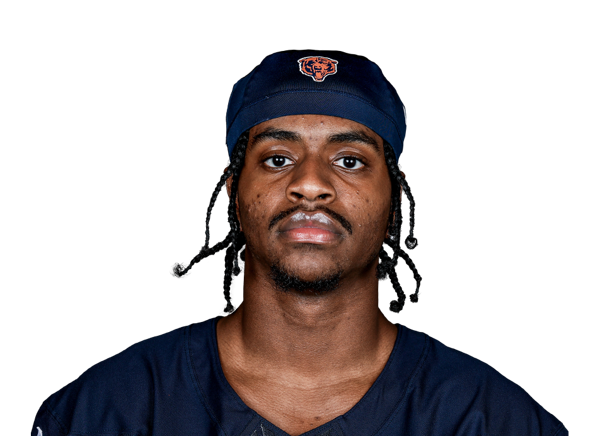 Jahdae Walker | WR | 24 | 6' 3" | 206 | 2 | Texas A&M |
|---|
| 10 | LB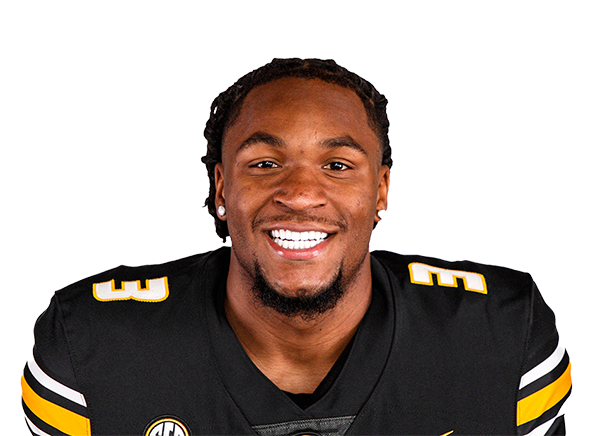 Luther Burden III | WR | 22 | 6' 0" | 210 | 2 | Missouri |
|---|
| 13 | ZT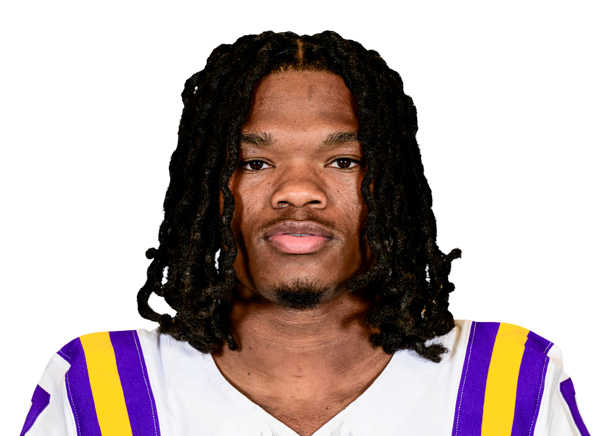 Zavion Thomas | WR | 22 | 5' 10" | 190 | R | LSU |
|---|
| 14 | KR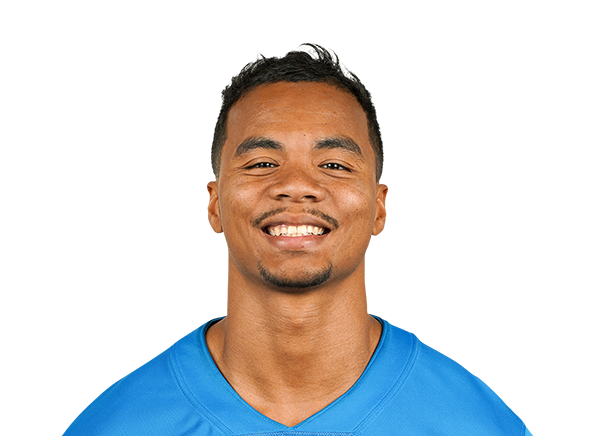 Kalif Raymond | WR | 32 | 5' 9" | 160 | 10 | Holy Cross |
|---|
| 15 | RO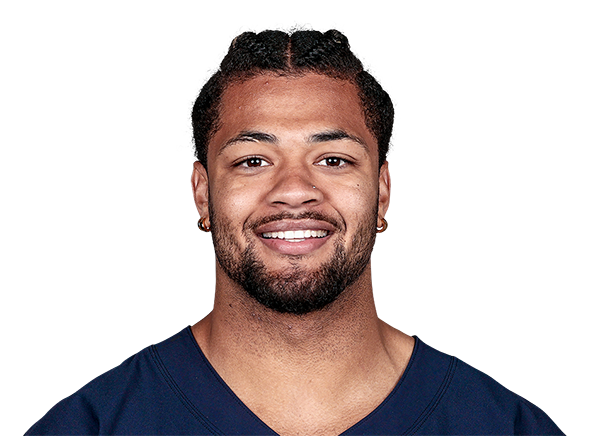 Rome Odunze | WR | 24 | 6' 3" | 214 | 3 | Washington |
|---|
| 81 | KD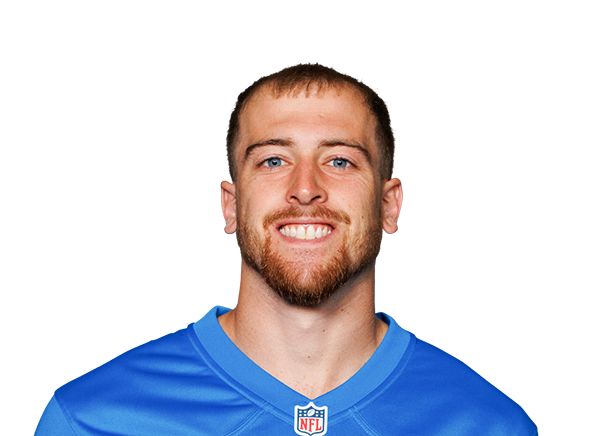 Kaden Davis | WR | 28 | 6' 1" | 193 | 1 | Northwest Missouri State |
|---|
| 84 | CL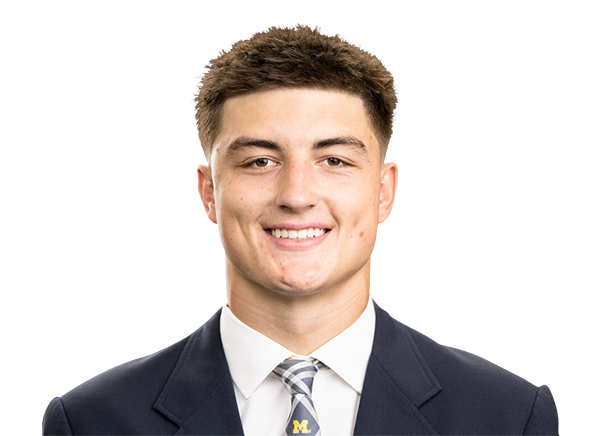 Colston Loveland | TE | 22 | 6' 6" | 241 | 2 | Michigan |
|---|
| 87 | SR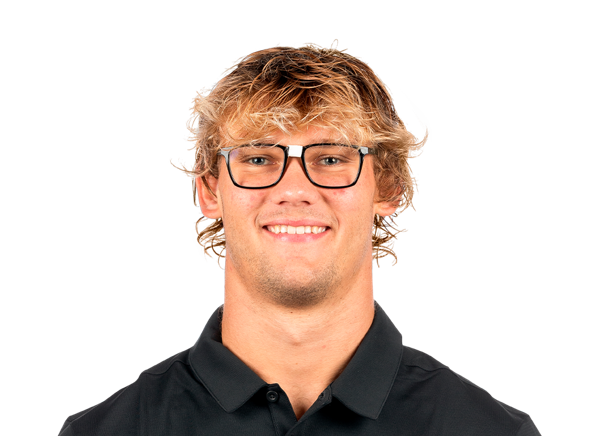 Sam Roush | TE | 23 | 6' 5" | 267 | R | Stanford |
|---|
| 88 | SC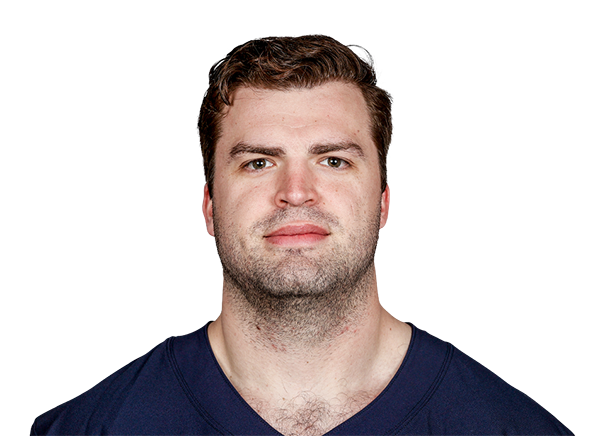 Stephen Carlson | TE | 29 | 6' 4" | 248 | 4 | Princeton |
|---|
| 58 | DW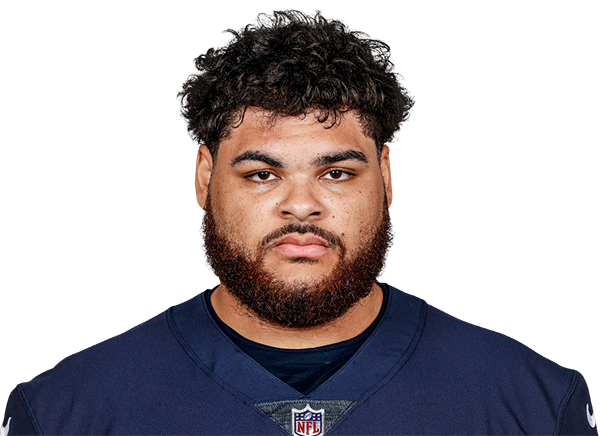 Darnell Wright | OT | 25 | 6' 5" | 325 | 4 | Tennessee |
|---|
| 65 | LN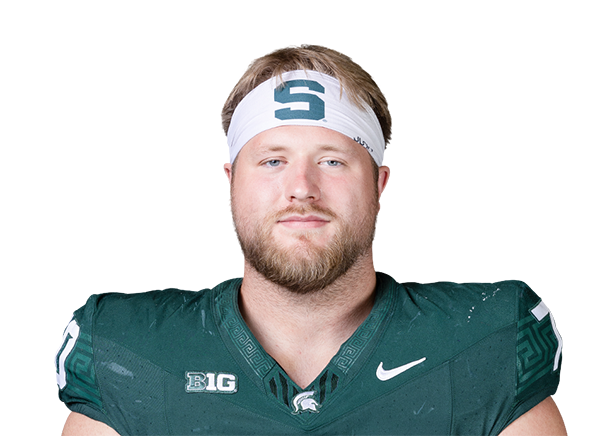 Luke Newman | OT | 24 | 6' 3" | 308 | 2 | Michigan State |
|---|
| 75 | OT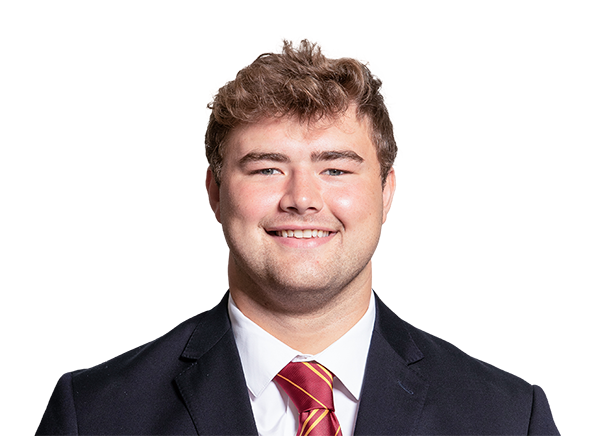 Ozzy Trapilo | OT | 25 | 6' 8" | 312 | 2 | Boston College |
|---|
| 79 | TB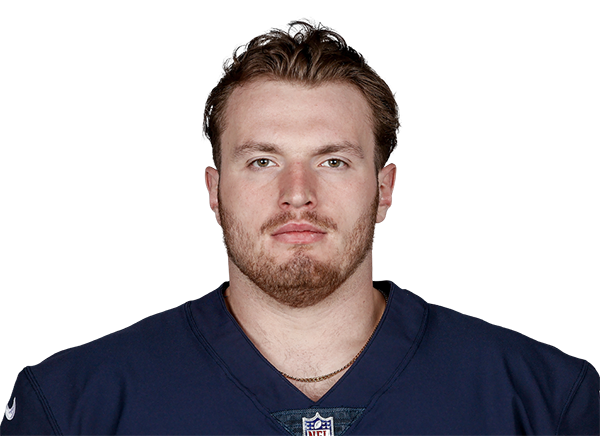 Theo Benedet | OT | 25 | 6' 7" | 304 | 2 | British Columbia |
|---|
| 62 | JT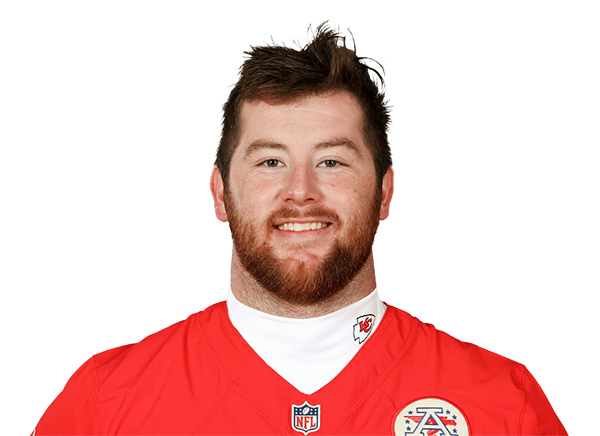 Joe Thuney | G | 34 | 6' 5" | 301 | 11 | NC State |
|---|
| 73 | JJ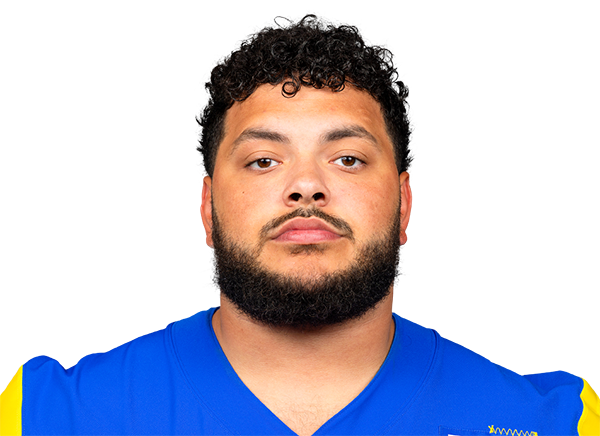 Jonah Jackson | G | 29 | 6' 3" | 319 | 7 | Ohio State |
|---|
| 74 | JM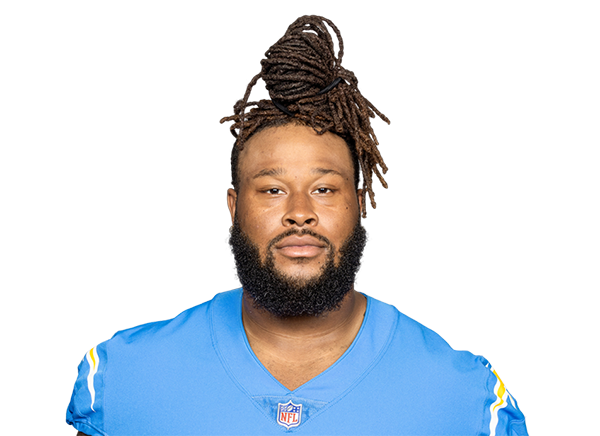 Jordan McFaddenOut | G | 27 | 6' 2" | 306 | 4 | Clemson |
|---|
| 54 | LJ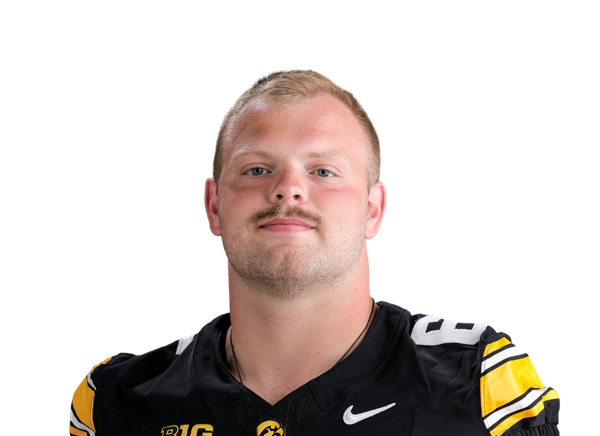 Logan Jones | C | 25 | 6' 3" | 299 | R | Iowa |
|---|
| 67 | GB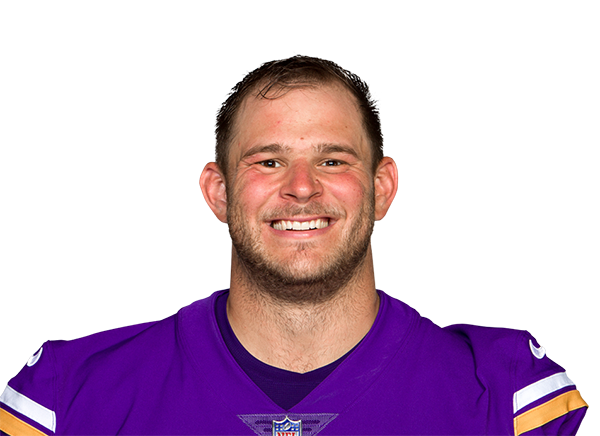 Garrett Bradbury | C | 31 | 6' 3" | 305 | 8 | NC State |
|---|
| # | Player | Pos | Age | Ht | Wt | Exp | College |
|---|---|---|---|---|---|---|---|
| 50 | GJ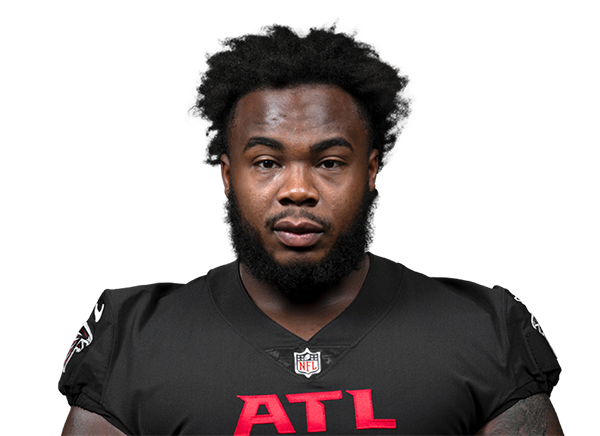 Grady Jarrett | DE | 33 | 6' 1" | 294 | 12 | Clemson |
| 52 | MD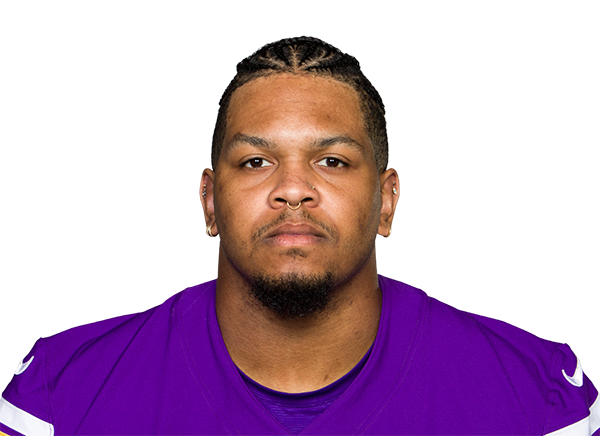 Marcus Davenport | DE | 30 | 6' 6" | 265 | R | UTSA |
| 92 | DH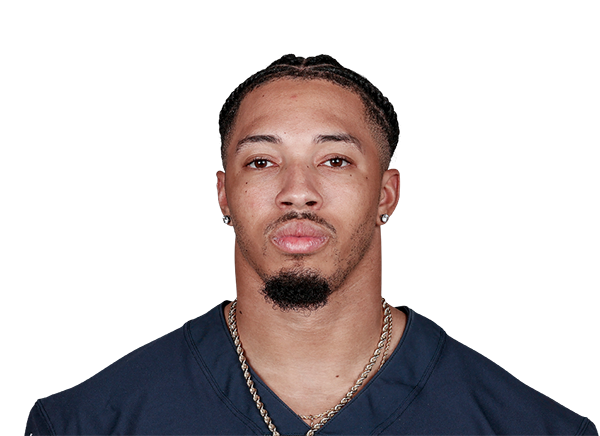 Daniel Hardy | DE | 27 | 6' 2" | 255 | 4 | Montana State |
| 94 | AB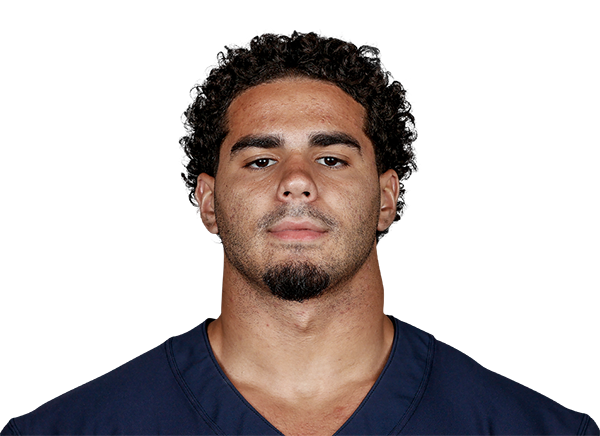 Austin Booker | DE | 23 | 6' 6" | 245 | 3 | Kansas |
| 98 | MS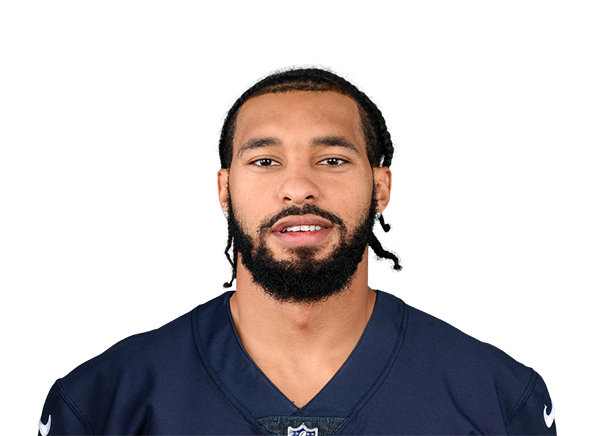 Montez Sweat | DE | 30 | 6' 6" | 270 | 8 | Mississippi State |
| 90 | NG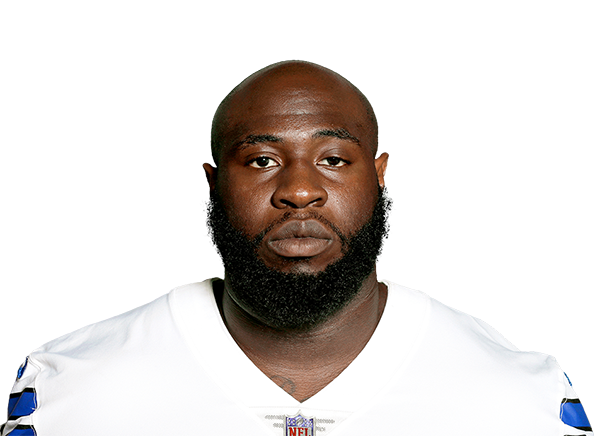 Neville Gallimore | DT | 29 | 6' 2" | 307 | 7 | Oklahoma |
| 91 | JL Jayden LovingOut | DT | 23 | 6' 1" | 309 | R | Wake Forest |
| 95 | ST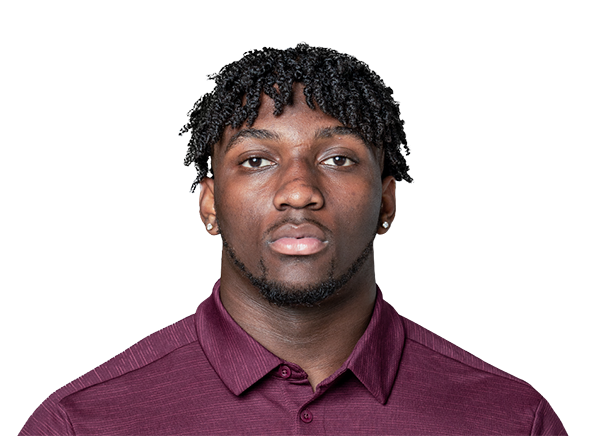 Shemar Turner | DT | 23 | 6' 3" | 293 | 2 | Texas A&M |
| 96 | Jv Jordan van den Berg | DT | 24 | 6' 3" | 310 | R | Georgia Tech |
| 97 | JL James Lynch | DT | 27 | 6' 4" | 295 | 7 | Baylor |
| 99 | JS Jeffery Simmons | DT | 29 | 6' 4" | 305 | 8 | Mississippi State |
| 12 | DB Devin Bush | LB | 28 | 5' 11" | 234 | 8 | Michigan |
| 44 | NS Noah Sewell | LB | 24 | 6' 1" | 246 | 4 | Oregon |
| 48 | DJ D'Marco Jackson | LB | 28 | 6' 1" | 233 | 5 | App State |
| 49 | KE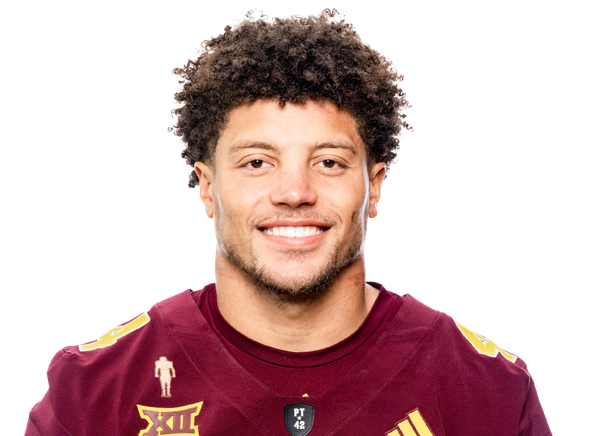 Keyshaun ElliottOut | LB | 22 | 6' 1" | 233 | R | Arizona State |
| 53 | TE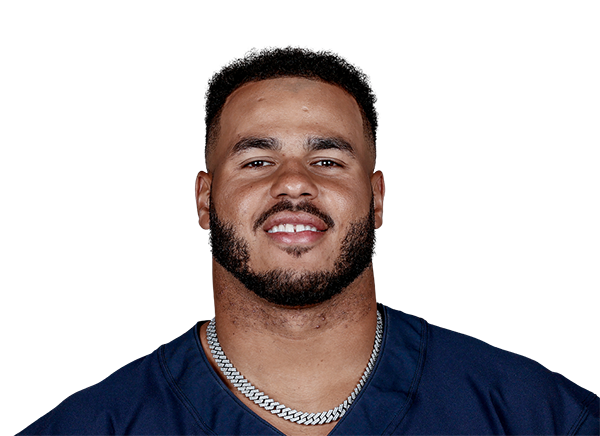 T.J. Edwards | LB | 30 | 6' 0" | 228 | 8 | Wisconsin |
| 57 | JS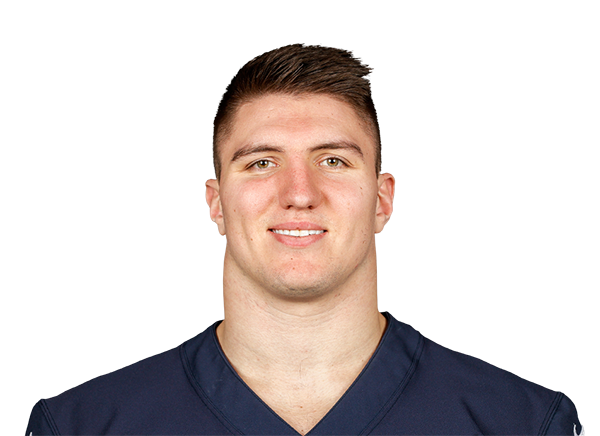 Jack Sanborn | LB | 26 | 6' 2" | 234 | 5 | Wisconsin |
| 1 | JJ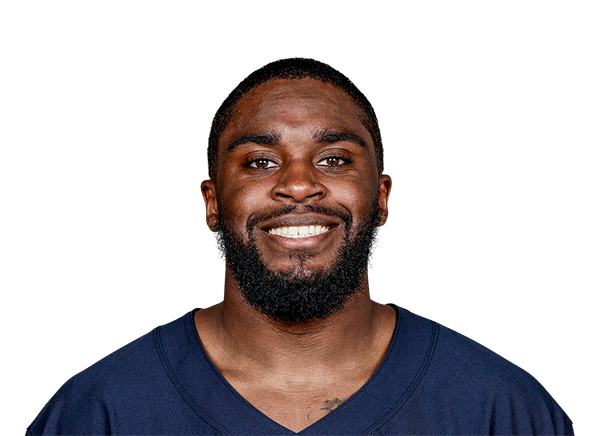 Jaylon Johnson | CB | 27 | 6' 0" | 195 | 7 | Utah |
| 6 | KG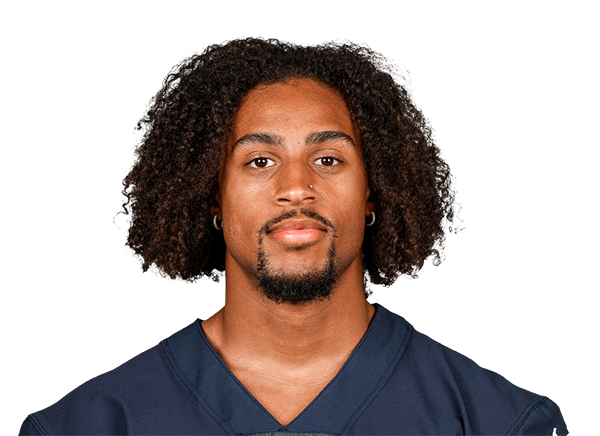 Kyler GordonOut | CB | 26 | 5' 11" | 200 | 5 | Washington |
| 20 | CP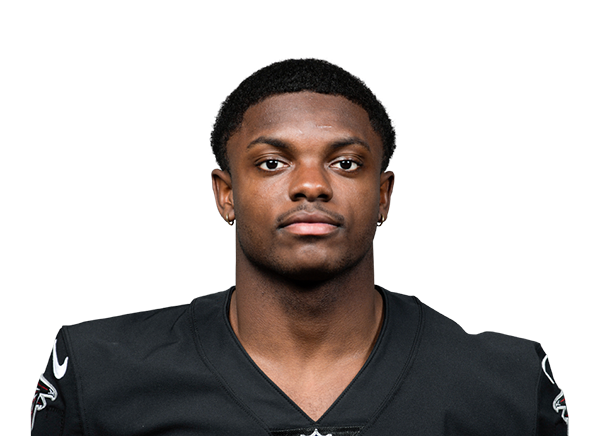 Clark Phillips III | CB | 24 | 5' 9" | 185 | 4 | Utah |
| 21 | CL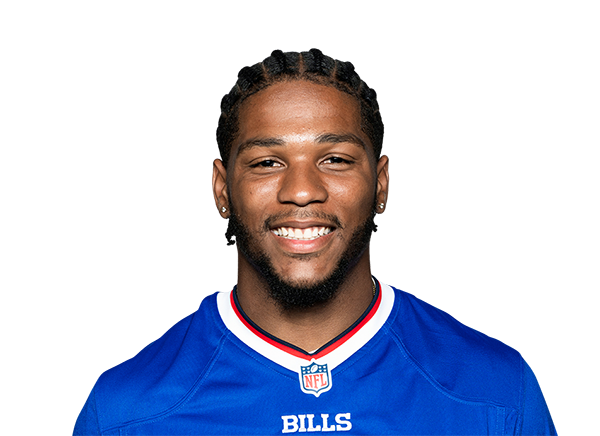 Cam Lewis | CB | 29 | 5' 9" | 183 | 7 | Buffalo |
| 24 | MM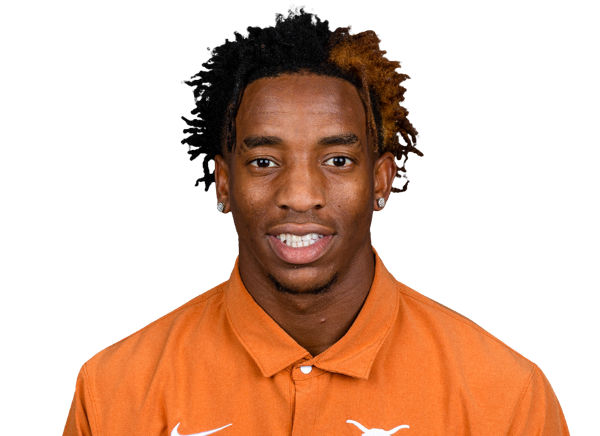 Malik Muhammad II | CB | 22 | 6' 0" | 182 | R | Texas |
| 29 | TS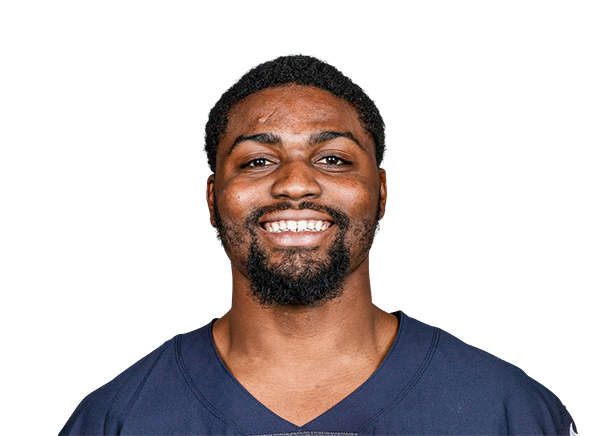 Tyrique Stevenson Sr. | CB | 26 | 6' 0" | 212 | 4 | Miami |
| 39 | JB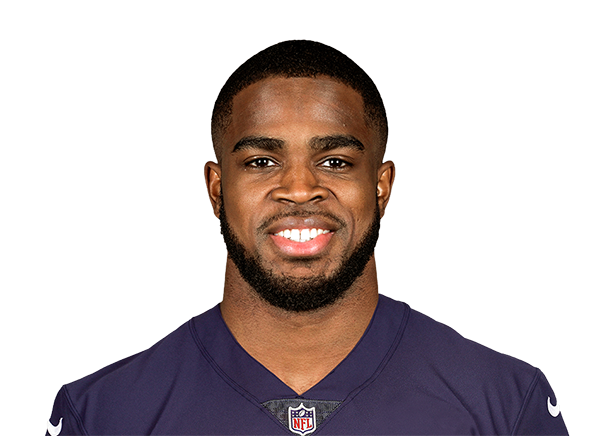 Josh Blackwell | CB | 27 | 5' 11" | 179 | 5 | Duke |
| 22 | EH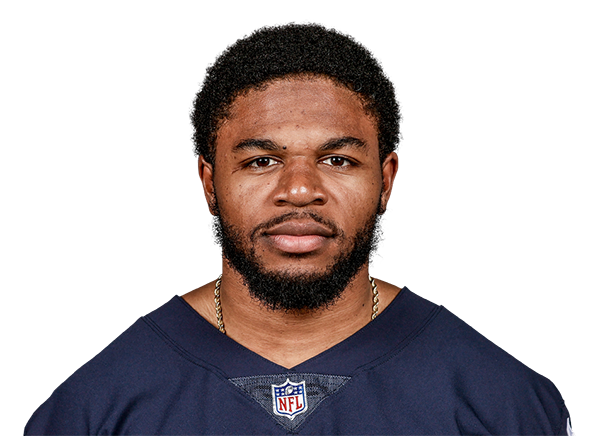 Elijah Hicks | S | 27 | 5' 11" | 204 | 5 | California |
| 31 | DT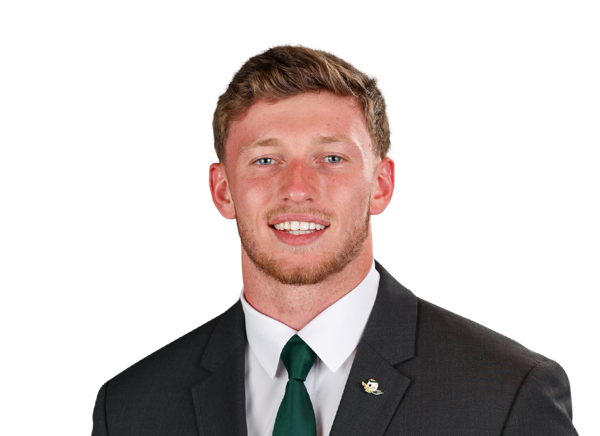 Dillon Thieneman | S | 22 | 6' 0" | 201 | R | Oregon |
| 38 | ST Skyler Thomas | S | 23 | 6' 2" | 191 | R | Oregon State |
| # | Player | Pos | Age | Ht | Wt | Exp | College |
|---|---|---|---|---|---|---|---|
| 8 | CS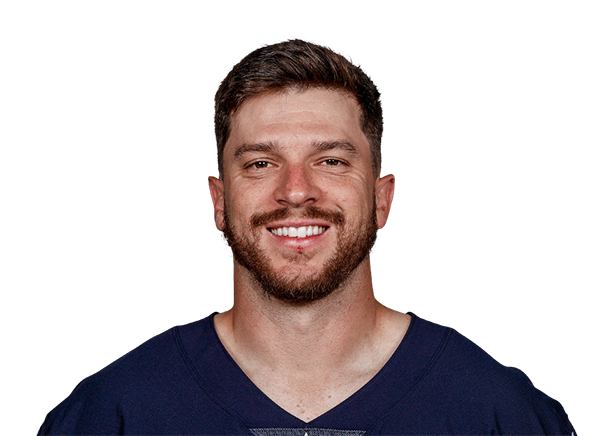 Cairo Santos | PK | 35 | 5' 8" | 173 | 13 | Tulane |
| 19 | TT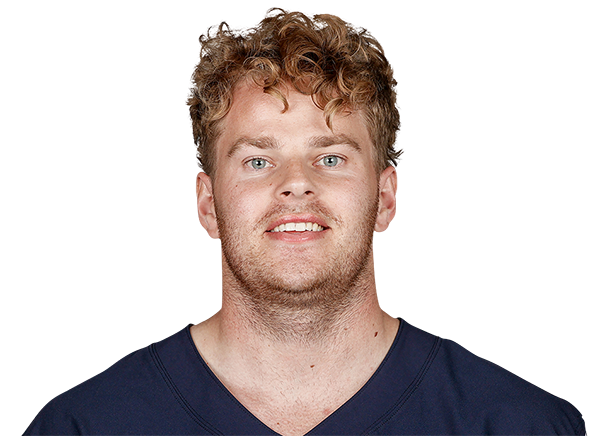 Tory Taylor | P | 29 | 6' 4" | 225 | 3 | Iowa |
| 46 | SD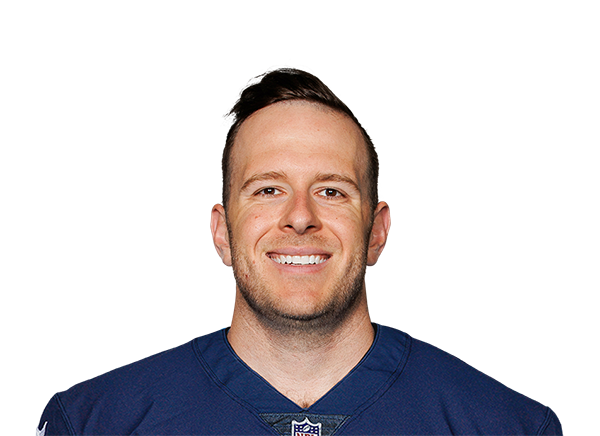 Scott Daly | LS | 32 | 6' 2" | 245 | 6 | Notre Dame |
| # | Player | Pos | Age | Ht | Wt | Exp | College |
|---|---|---|---|---|---|---|---|
| 30 | ZS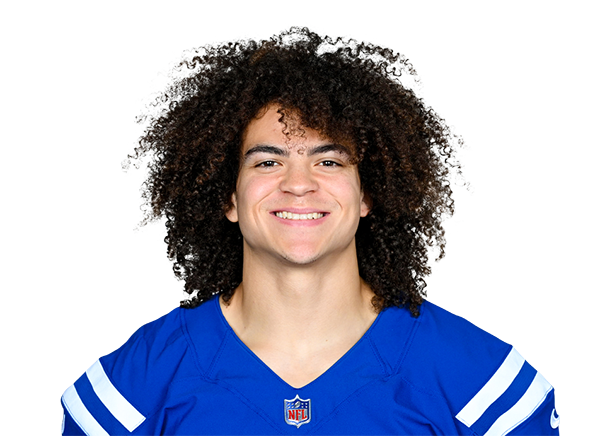 Zavier ScottInjured Reserve | RB | 27 | 6' 1" | 221 | 2 | Maine |
| 38 | BB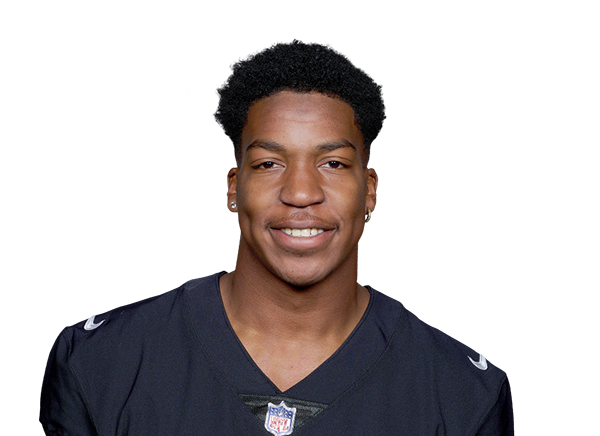 Brittain BrownInjured Reserve | RB | 29 | 6' 1" | 205 | 3 | UCLA |
| 43 | HL Hayden LargeInjured Reserve | TE | 24 | 6' 4" | 250 | R | Iowa |
| 85 | CK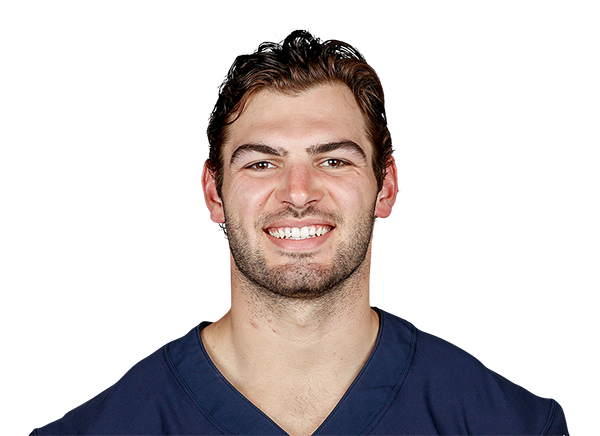 Cole KmetInjured Reserve | TE | 27 | 6' 6" | 257 | 7 | Notre Dame |
| 86 | NK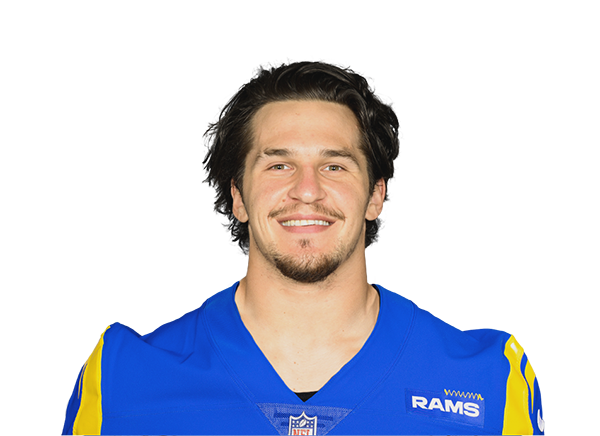 Nikola KalinicInjured Reserve | TE | 29 | 6' 4" | 248 | 2 | — |
| 70 | BJ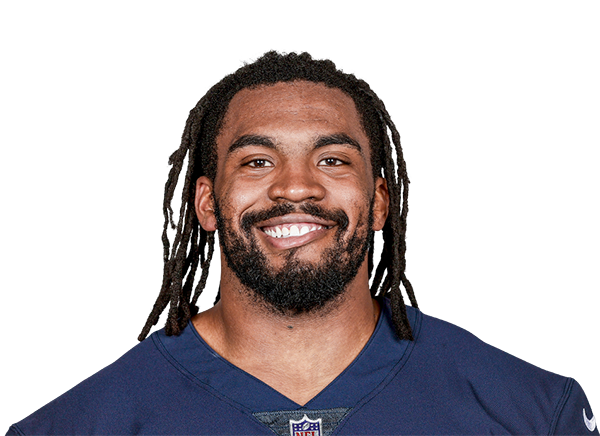 Braxton JonesInjured Reserve | OT | 27 | 6' 5" | 303 | 5 | Southern Utah |
| 55 | DO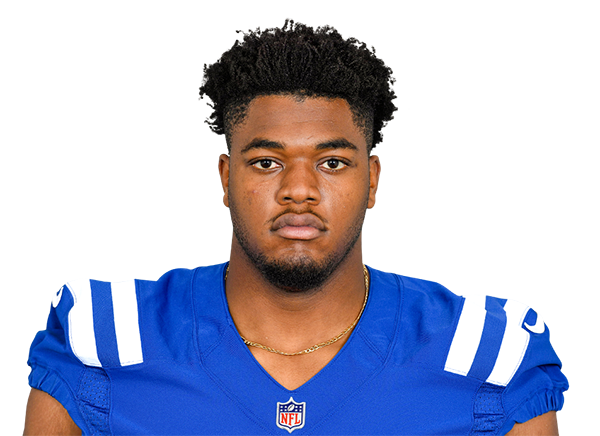 Dayo OdeyingboInjured Reserve | DE | 27 | 6' 5" | 282 | 6 | Vanderbilt |
| 93 | KS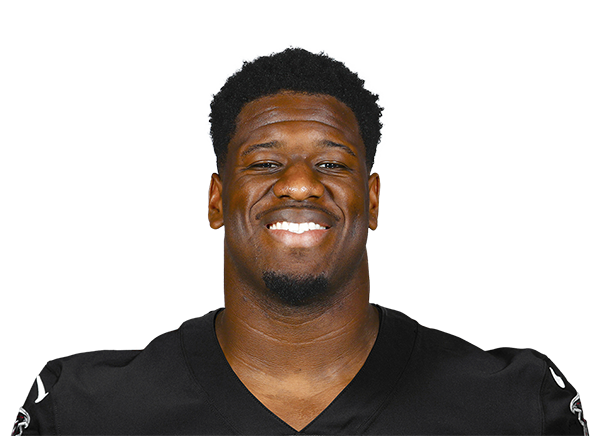 Kentavius StreetInjured Reserve | DT | 30 | 6' 2" | 315 | 8 | NC State |
| 43 | TF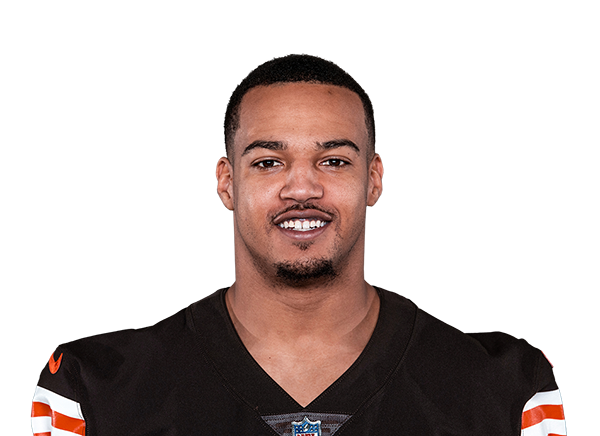 Tony Fields IIInjured Reserve | LB | 27 | 6' 1" | 220 | 6 | West Virginia |
| 45 | NS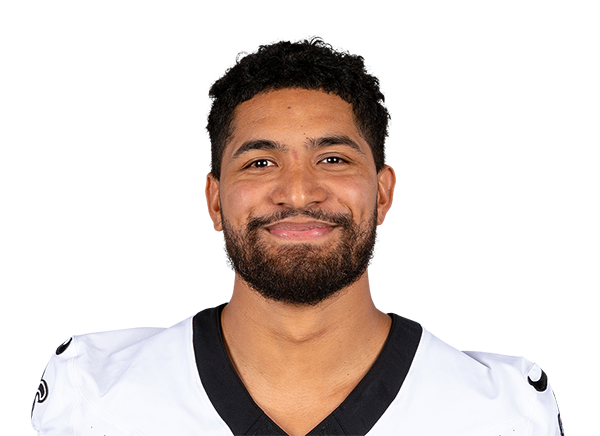 Nephi SewellInjured Reserve | LB | 27 | 6' 0" | 228 | 3 | Utah |
| 47 | RH Ruben Hyppolite IIInjured Reserve | LB | 25 | 6' 0" | 236 | 2 | Maryland |
| 37 | DF Dallis FlowersInjured Reserve | CB | 29 | 6' 1" | 196 | 4 | Pittsburg State |
| 2 | CB Coby BryantInjured Reserve | S | 27 | 6' 1" | 193 | 5 | Cincinnati |
| # | Player | Pos | Age | Ht | Wt | Exp | College |
|---|---|---|---|---|---|---|---|
| 35 | SM Scotty Miller | WR | 29 | 5' 9" | 174 | 8 | Bowling Green |
| 83 | JR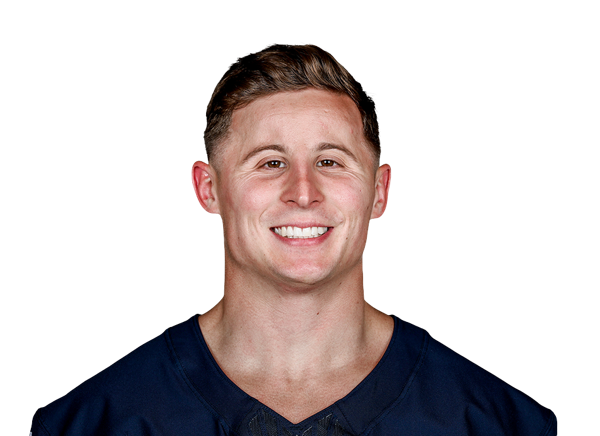 JP Richardson | WR | 24 | 5' 11" | 192 | 1 | TCU |
| 80 | QI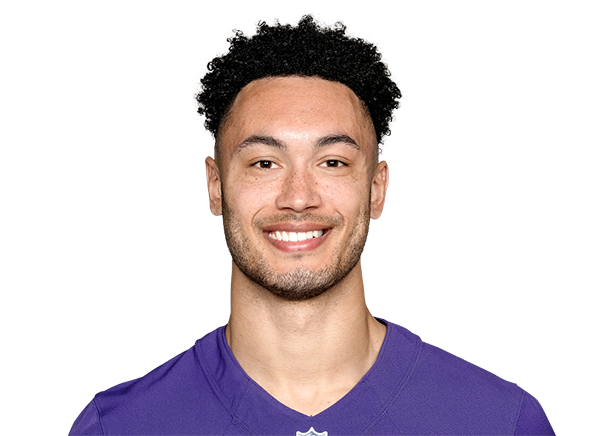 Qadir Ismail | TE | 26 | 6' 6" | 245 | 1 | Samford |
| — | CJ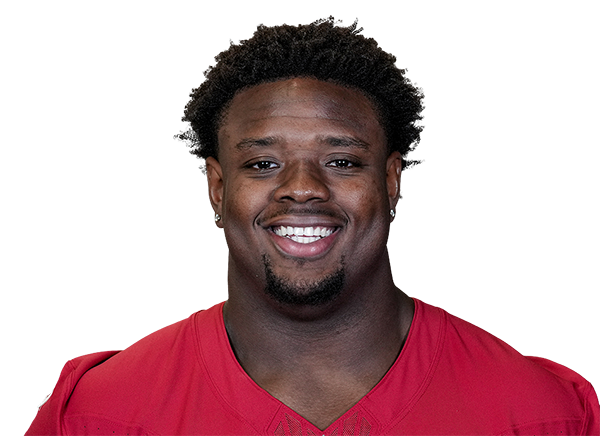 Christian Jones | OT | 26 | 6' 5" | 320 | 3 | Texas |
| 76 | CB Caden Barnett | G | 23 | 6' 4" | 316 | R | Wyoming |
| 99 | EB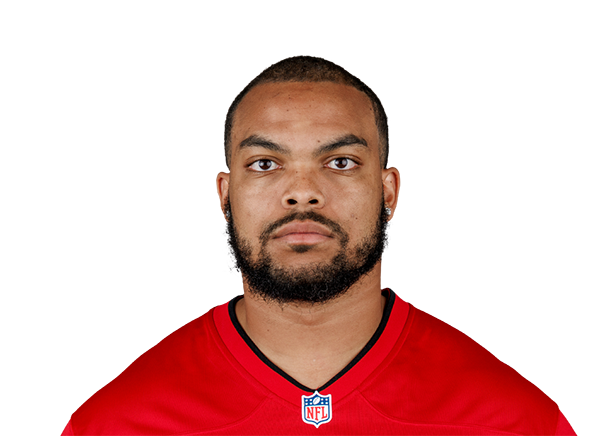 Earnest Brown IV | DE | 27 | 6' 5" | 270 | 3 | Northwestern |
| 35 | WM Wayne Matthews III | LB | 24 | 6' 0" | 221 | R | Michigan State |
| 47 | BJ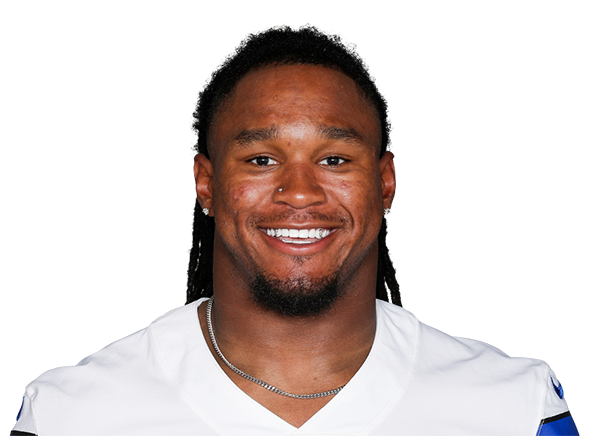 Buddy Johnson | LB | 27 | 6' 2" | 240 | 5 | Texas A&M |
| — | JB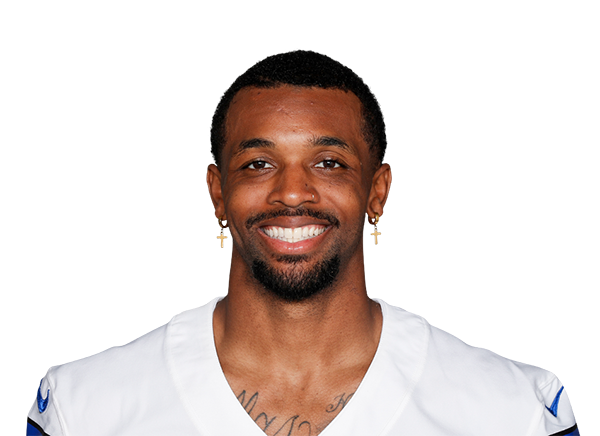 Josh Butler | CB | 29 | 6' 0" | 192 | 3 | Michigan State |
| 36 | MS Marlen SewellQuestionable | S | 23 | 6' 0" | 199 | R | Vanderbilt |
| — | EJ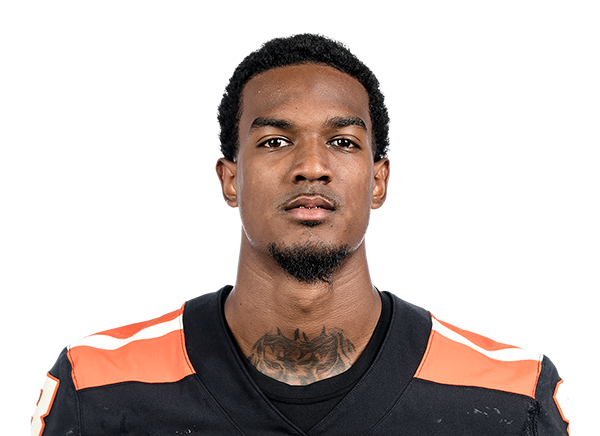 Elijah Jones | DB | 28 | 6' 2" | 194 | R | Oregon State |
| — | KS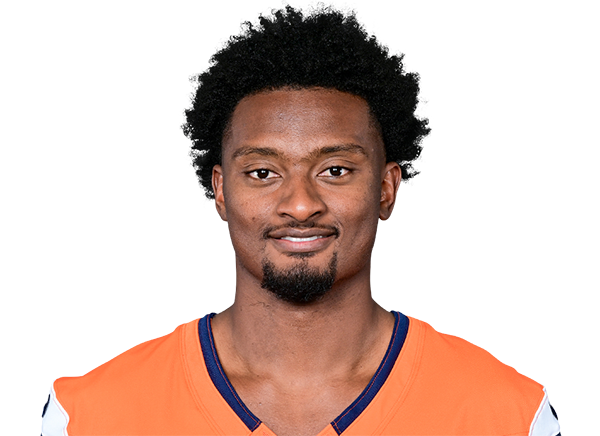 Keidron Smith | DB | 27 | 6' 2" | 210 | 2 | Kentucky |
| 45 | BG Beau Gardner | LS | 24 | 6' 5" | 249 | R | Georgia |
| 11% |
| 3rd & long (7+) | 51 | 18% / 24% | 6% |
| 4th down | 12 | 33% / 22% | 25% |
| Red zone | 44 | 9% / 14% | 2% |
| Two-minute drill | 53 | 19% / 17% | 2% |
The bar shows the team's pressure rate and the tick shows the league rate. LB/DB pressure is the share of dropbacks where a linebacker or DB was credited with a sack or hit. It's a proxy for blitzing, not a true blitz rate: ESPN play-by-play doesn't log rusher counts, so blitzes that don't get home aren't visible.
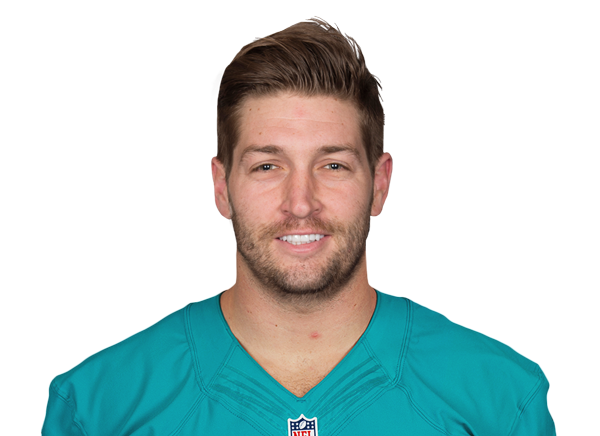
Jay Cutler
2009–2016
23,443
Jay Cutler
2009–2016
154
Matt Forte
2008–2015
8,602
Neal Anderson
1986–1993
51
Matt Forte
2008–2015
487
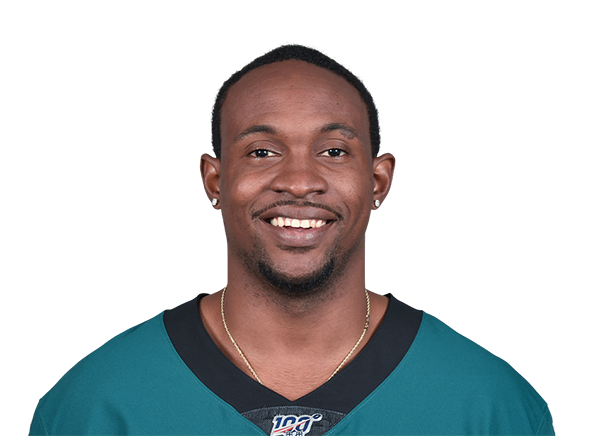
Alshon Jeffery
2012–2016
4,549
Curtis Conway
1993–1999
31
Richard Dent
1983–1995
124.5
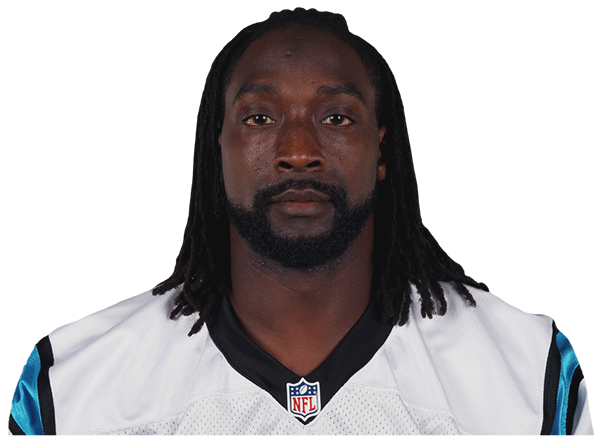
Charles Tillman
2003–2014
36
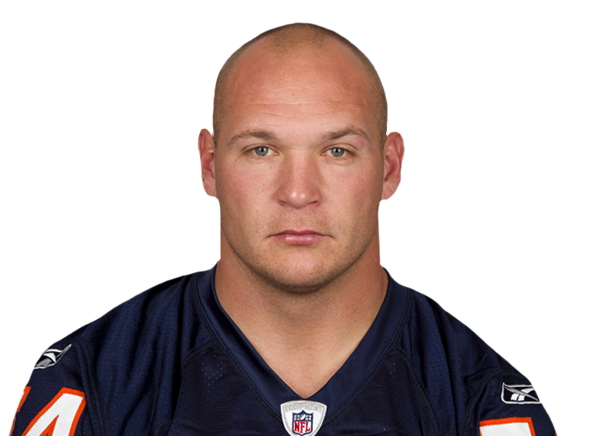
Brian Urlacher
2000–2012
1,353
Totals are regular-season stats while with this franchise, built from ESPN records (full statistical coverage from 1977 onward). Players whose careers ended before that may be missing.