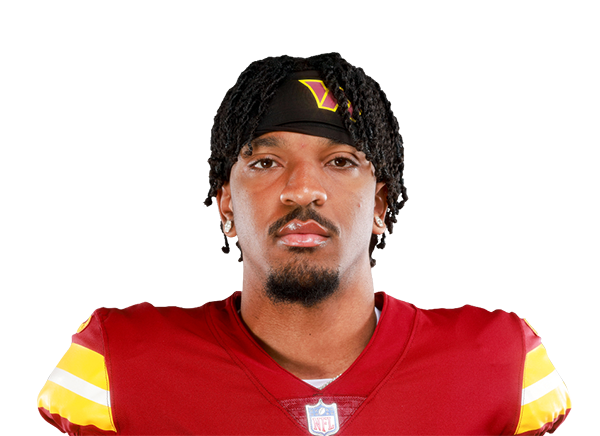
Jayden Daniels is holding steady: 17.7 PPR per game over his last two games (Weeks 9–10), vs. 19.7 in Weeks 1, 2, 5, 6 and 8.
Full analysisBased on 7 games of box scores. Small samples swing on one big play or touchdown. Route participation and snap counts aren't in the data, so opportunity is measured by targets and carries, and role changes stay unconfirmed.
| Metric | LatestWeek 10 @ NYG | Last 2 gamesWeeks 9–10 | Earlier averageWeeks 1, 2, 5, 6, 8 and 9 | Season averageWeeks 1, 2, 5, 6, 8, 9 and 10 |
|---|---|---|---|---|
| Pass attemptsOpportunity | 33.0 | 34.0 | 30.0 | 30.4 |
| Dropbacks and runs per gameOpportunity | 44.0 | 41.5 |
fantasy pts / game (PPR)
His pass attempts held steady in Week 10 (33.0, vs. 30.0 in Weeks 1, 2, 5, 6, 8 and 9), so his opportunity has not changed meaningfully.
His Week 10 output (20.8 PPR) was close to his average in Weeks 1, 2, 5, 6, 8 and 9 (18.9).
7.0 yards per attempt over the season (Weeks 1, 2, 5, 6, 8, 9 and 10) (the typical QB is at 6.8), and 7.7 over his last two games (Weeks 9–10).
Compares 2026 play-by-play and box score data against 44 qualified QBs across 7 games.
Closest statistical profile
A label for the percentile pattern on the right, not a scouting judgment.
Rushing yards per game rank high among QBs, alongside his passing efficiency.
He rushes for more yards per game than most (rush yards / game 40.0, top 1% of QBs).
INT rate of 0.9% ranks in the top 12% of qualified QBs.
3 NFL seasons and 6,329 career passing yards. Best year: 3,568 in 2024.
Strengths
Areas to watch
No quality measure in the bottom 30% of QBs.
Percentile vs. QBs
| Season | Team | GP | CMP | ATT | CMP% | YDS | AVG | TD | INT | LNG | SACK | RTG | QBR |
|---|---|---|---|---|---|---|---|---|---|---|---|---|---|
| 2024 | WSH | 17 | 331 | 480 | 69.0 | 3,568 | 7.4 |
| 35.2 |
| 36.4 |
| Yards per attemptEfficiency | 7.5 | 7.7 | 6.9 | 7.0 |
|---|
| TD points per gameTouchdowns | 12.0 | 8.0 | 6.7 | 7.4 |
|---|
| PPR points per gameResult | 20.8 | 17.7 | 18.9 | 19.1 |
|---|
He's throwing an interception on 0.9% of his attempts. Low turnover risk keeps drives alive and his floor high.
Opponents in his last two games (Weeks 9–10), LAR and NYG, give up less EPA per play than the league average. He has been producing against strong opponents, so the numbers are probably underselling him.
Colored bars are quality measures. Gray "style" bars show how often he does something, not whether it's good.
| @ DAL |
| 11/17 |
| 96 |
| 1 |
| 0 |
| 7 |
| 69 |
| 0 |
| — |
| — |
| — |
| — |
| 14.7 |
| 5 | vs NYG | 17/25 | 199 | 0 | 0 | 9 | 103 | 2 | — | — | — | — | 30.3 |
|---|
| 6 | @ SF | 29/40 | 300 | 2 | 0 | 4 | 10 | 0 | — | — | — | — | 21.0 |
|---|
| 8 | vs PHI | 16/29 | 217 | 1 | 0 | 2 | 23 | 0 | — | — | — | — | 15.0 |
|---|
| 9 | vs LAR | 24/35 | 274 | 1 | 0 | 4 | 16 | 0 | — | — | — | — | 14.6 |
|---|
| 10 | @ NYG | 23/33 | 249 | 3 | 2 | 11 | 28 | 0 | — | — | — | — | 20.8 |
|---|
| 25 |
| 9 |
| 86 |
| 47 |
| 100.1 |
| 67.7 |
| 2025 | WSH | 7 | 114 | 188 | 60.6 | 1,262 | 6.7 | 8 | 3 | 50 | 18 | 88.1 | 44.7 |
|---|
| 2026 | WSH | 7 | 138 | 213 | 64.8 | 1,499 | 7.0 | 10 | 2 | 53 | 17 | 97.1 | 60.5 |
|---|
| Career | 31 | 583 | 881 | 66.2 | 6,329 | 7.2 | 43 | 14 | 86 | 82 | 96.8 | - | |
|---|---|---|---|---|---|---|---|---|---|---|---|---|---|

 Washington Commanders