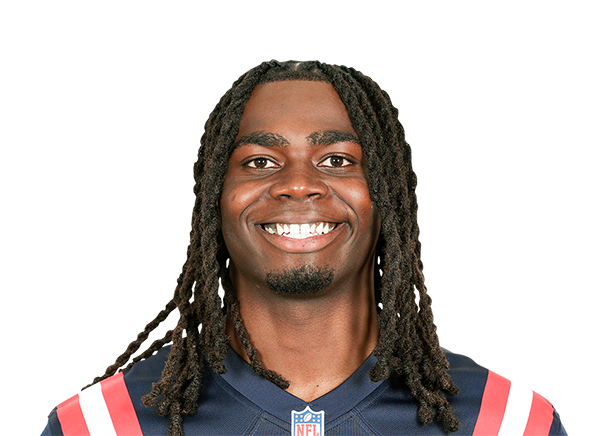
 New England Patriots
- Position
- Running Back
- Height / Weight
- 6' 0", 227 lbs
- Born
- 23/2/1998 in Las Vegas, NV
- Age
- 28
- College
- Oklahoma
- Draft
- 2021: Rd 4, Pk 120 (NE)
- Experience
- 6th Season
- Status
- Active
Why he's performing this way
The usage, efficiency, schedule and team factors behind his recent numbers.
Rhamondre Stevenson has cooled off. He's at 6.8 fantasy pts / game (PPR) over his last game, down from 9.1.
- Recent
- 6.8
- Season
- 8.3
fantasy pts / game (PPR)
- Shrinking role
He's averaging 10.0 touches over his last game, compared with 16.0 before that. Fewer chances cap his ceiling no matter how efficient he is.
- Low target share
He draws 13% of NE's targets. At this share he needs big plays or touchdowns to produce.
- League-average efficiency
3.7 yards per carry on the season (the typical RB is at 3.9), and 3.1 over his last game.
- Scoring without touchdowns
0% of his fantasy points come from touchdowns. His yardage is doing the work, so there is upside if the touchdowns start coming.
- Tough recent schedule
Opponents in his last game (JAX) give up less EPA per play than the league average. He has been producing against strong opponents, so the numbers are probably underselling him.
- Struggling offense around him
NE are averaging -0.20 EPA per play on offense. Stalled drives and fewer red-zone trips limit what he can produce.
Play style & archetype
Compares 2026 play-by-play and box score data against 50 qualified RBs across 3 games.
Archetype
Receiving back
A weapon in the passing game who wins as a checkdown, screen and route runner.
Fumbles lost / touch of 2.50% ranks in the bottom 6% of qualified RBs.
He does a lot of his damage as a receiver (receiving share of yards 35.2%, top 12% of RBs).
Rush TD rate of 0.0% ranks in the bottom 21% of qualified RBs.
6 NFL seasons and 3,785 career rushing yards. Best year: 1,040 in 2022.
Strengths
Nothing stands out.
Areas to watch
- Fumbles lost / touch (2.50%)
- Rush TD rate (0.0%)
Percentile vs. RBs
- Carries / gamestyle10.3 · 39
- Team carry sharestyle36.5% · 35
- Yards / carry3.7 · 41
- Rush TD rate0.0% · 21
- Targets / gamestyle3.7 · 72
- Receiving share of yardsstyle35.2% · 88
- Yards / target5.7 · 57
- Fumbles lost / touch2.50% · 6
Colored bars are quality measures. Gray "style" bars show how often he does something, not whether it's good.
Where he's targeted
64%
left
9%
middle
27%
right
0% of targets deep (15+ air yards), 100% short
Career statistics
Regular season, by year and team. Career bests are highlighted.
Rushing
Receiving
Defense
Returning
| Season | Team | GP | ATT | YDS | TD | FC | LNG | ATT | YDS | TD | KRFC | LNG |
|---|---|---|---|---|---|---|---|---|---|---|---|---|
| 2025 | NE | 14 | 0 | 0 | 0 | 0 | 0 | 2 | 40 | 0 | 0 | 23 |
| Career | 73 | 0 | 0 | 0 | 0 | 0 | 2 | 40 | 0 | 0 | 23 | |
Scoring
2026 game log
Box score lines from completed games this season.