
Offense
619 plays · 10 games
- BalancedNeutral early-down pass rate of 52%, right around league average.
- Attacks the middle29% of targets go between the numbers.
- Neutral pass rate
- 52% lg 51%
- Shotgun rate
- 55% lg 61%
- Deep pass rate
- 18% lg 19%

2026 season
4-6 · 3rd in AFC West · Head coach Klint Kubiak · Allegiant Stadium
GameLens rank
#24
-8.0 pts (incl. -1.7 injuries)
Off EPA
-0.03
per play
Def EPA
+0.15
allowed
LV rank #24 of 32 in GameLens, -8.0 pts vs. an average team on a neutral field. Identity: balanced.
Full analysisBuilt from 10 games, so one result still moves the rating a lot. The current injury report is costing 1.7 pts, and statuses can change before kickoff. Scheme labels are inferred from play-by-play; coverage and rusher counts aren't charted.
After Week 9 vs. After Week 10 (L 13-21 vs SEA).
Summary: Game grade 32/100 for the L 13-21 vs SEA, ranked against every team-game this season. Rating effect: +0.5 pts (after Week 9 → after Week 10, before injuries). Why a weak game still raised it: the grade compares this game with the whole league, but the rating compares it with this team's own level. Going in, that level implied -14.2 on a neutral field vs SEA; the game measured -15.9, 1.7 pts short of that. Biggest factor: opponent adjustment (+0.9; the other parts net -0.4).
Identified from 2026 play-by-play and compared against the league average.
619 plays · 10 games
Where opponents throw against them, and who is credited with sacks and QB hits, across 10 games and 321 opponent dropbacks. Coverage shells and rusher counts aren't in the data, so any coverage label is an inference.
Where opponents throw, how often they complete, and how often the rush records pressure (a sack or QB hit), from 321 opponent dropbacks. Coverage leans below are inferred from these, not charted.
Completion % allowed by zone
3WR 1TE
| # | Player | Pos | Age | Ht | Wt | Exp | College |
|---|---|---|---|---|---|---|---|
| 12 | AO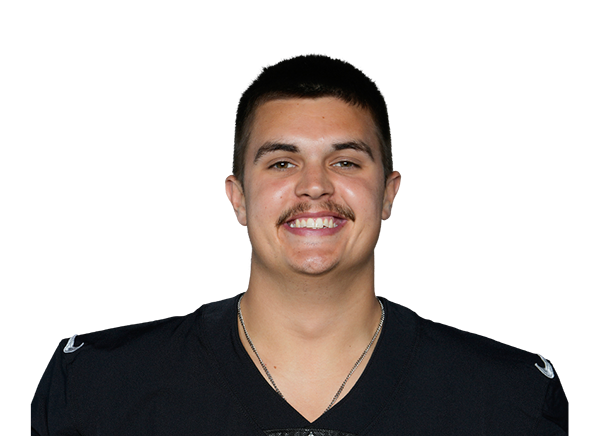 Aidan O'Connell | QB | 28 | 6' 3" | 206 | 4 | Purdue |
| 15 | FM Fernando Mendoza |
These four parts add up exactly to the total before rounding. "Biggest factor" is shown only when one part moved the same way as the total and makes up at least 60% of the movement.
The team hasn't played since After Week 10, so its own results are unchanged. Its rating still moves because each win or loss is worth more or less as those opponents' ratings update: a game against an opponent who has since looked stronger counts for more.
From today's ESPN injury report (total -1.7 pts). ESPN doesn't publish past reports, so this shows current status rather than a week-over-week change.
Each cell: completion %, yards per attempt and attempts (n). Green is at least 5 points below the league completion rate for that zone, red at least 5 above. Cells with fewer than 5 attempts stay neutral.
Defenders named in pass-play descriptions
Attribution: the first defender named in parentheses after the receiver in ESPN's play text. That is usually the tackler on a catch or the defender credited on an incompletion, not a charted coverage assignment. Only throws with a charted depth count, and defenders need at least 4 such targets.
| Defender | Tgts | Comp% | Yds/Tgt | TD |
|---|---|---|---|---|
| J.ChinnStrong safety | 31 | 97% | 12.5 | 0 |
| E.StokesLeft corner | 25 | 84% | 10.0 | 0 |
| T.StukesFree safety | 22 | 91% | 14.9 | 0 |
| N.DeanLeft inside LB | 22 | 95% | 8.3 | 0 |
| Q.WalkerRight inside LB | 20 | 100% | 9.4 | 0 |
| H.MassesRight corner | 19 | 79% | 10.8 | 0 |
Recorded pressure means a sack or QB hit. Each one is tied to the rusher's spot on the "Base 3-4 D" depth chart. Pressure credited to a linebacker or defensive back is treated as a likely blitz.
Recorded pressure
18%
58 of 321 drops · lg 17%
LB/DB pressure share
21%
12 of 58 pressures
Sacks
23
7% of 321 drops
Recorded pressure counts only sacks and QB hits; hurries are not in the play-by-play. LB/DB pressure share is a blitz proxy, not a blitz rate: it only sees blitzes that got home.
Where the pressure comes from
When they bring it
| Situation | Drops | Pressure vs league | LB/DB pressure |
|---|---|---|---|
| 1st down | 117 | 15% / 14% | 1% |
| 2nd down | 108 | 17% / 14% | 5% |
| 3rd & short (1-3) | 30 | 17% / 18% | 7% |
| 3rd & medium (4-6) | 22 |
Top blitzers
627 plays · 10 games
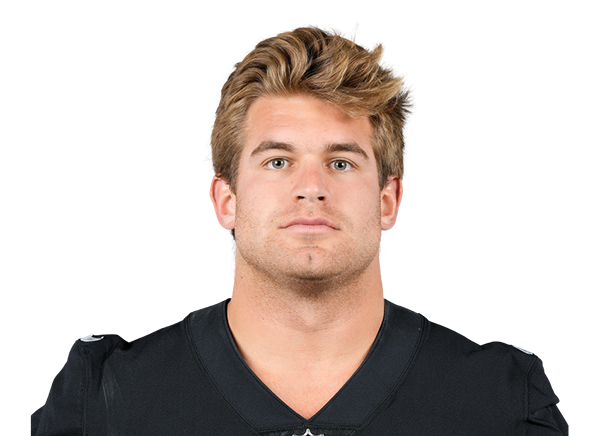 Michael Mayer#87
In for Brock Bowers (Out)
Base 3-4 D
| QB |
| 23 |
| 6' 5" |
| 225 |
| R |
| Indiana |
| 2 | AJ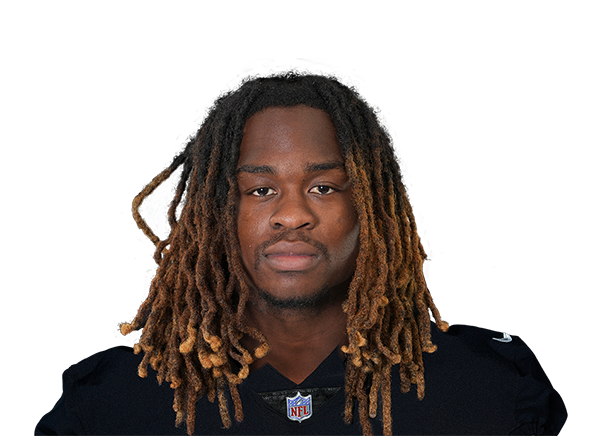 Ashton Jeanty | RB | 22 | 5' 8" | 208 | 2 | Boise State |
|---|
| 4 | MW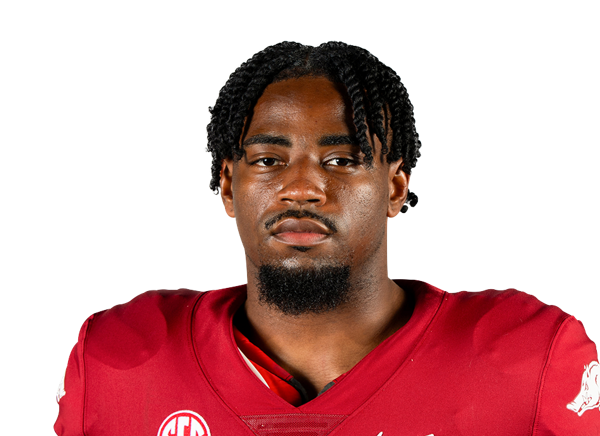 Mike Washington Jr. | RB | 23 | 6' 2" | 228 | R | Arkansas |
|---|
| 23 | DL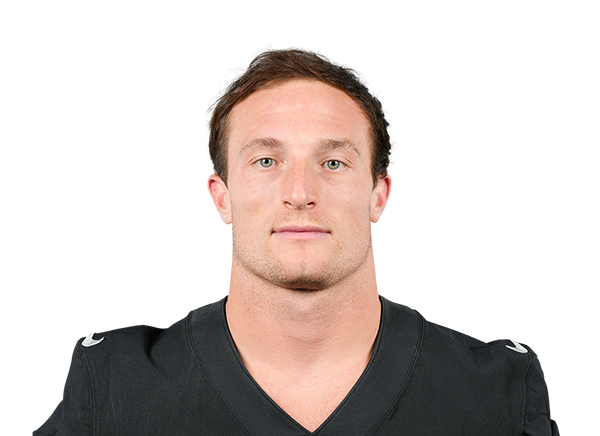 Dylan Laube | RB | 26 | 5' 9" | 204 | 3 | New Hampshire |
|---|
| 37 | RH Roman Hemby | RB | 24 | 6' 0" | 210 | R | Indiana |
|---|
| 34 | CH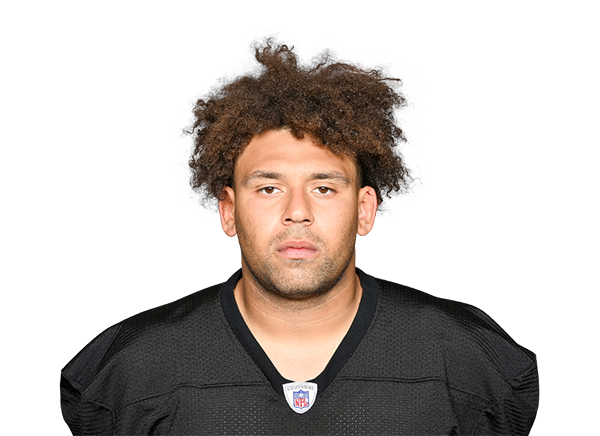 Connor Heyward | FB | 27 | 6' 0" | 230 | 5 | Michigan State |
|---|
| 1 | TT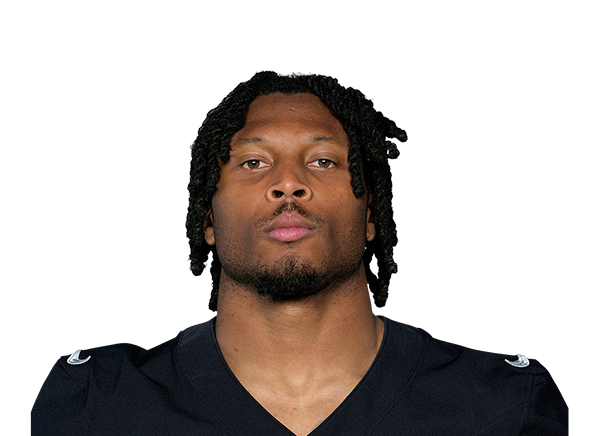 Tre Tucker | WR | 25 | 5' 8" | 182 | 4 | Cincinnati |
|---|
| 9 | JN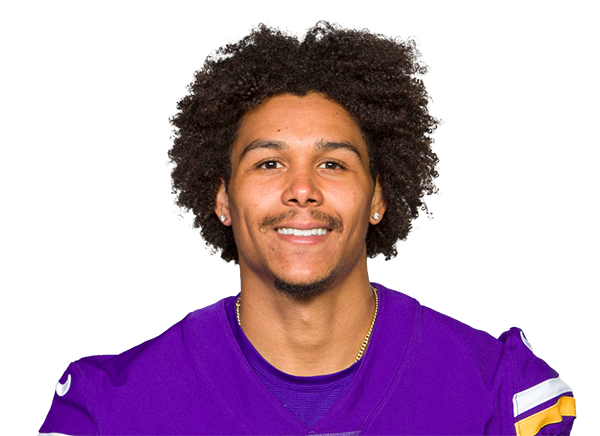 Jalen Nailor | WR | 27 | 6' 0" | 190 | 5 | Michigan State |
|---|
| 10 | DT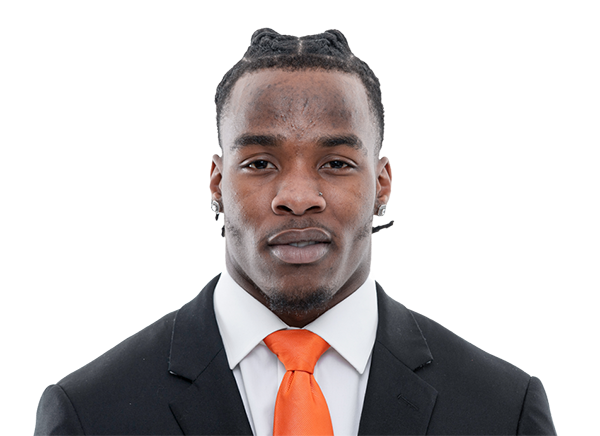 Dont'e Thornton Jr.Out | WR | 23 | 6' 5" | 205 | 2 | Tennessee |
|---|
| 18 | JB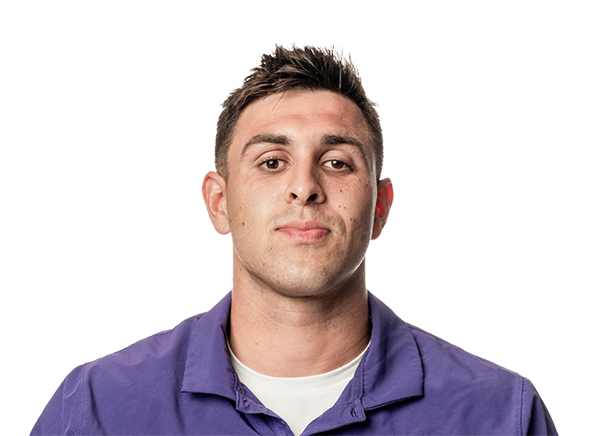 Jack Bech | WR | 23 | 6' 1" | 214 | 2 | TCU |
|---|
| 19 | MB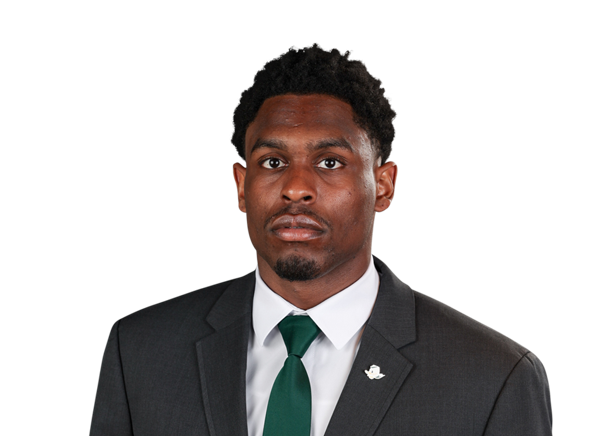 Malik BensonOut | WR | 24 | 6' 1" | 195 | R | Oregon |
|---|
| 81 | DY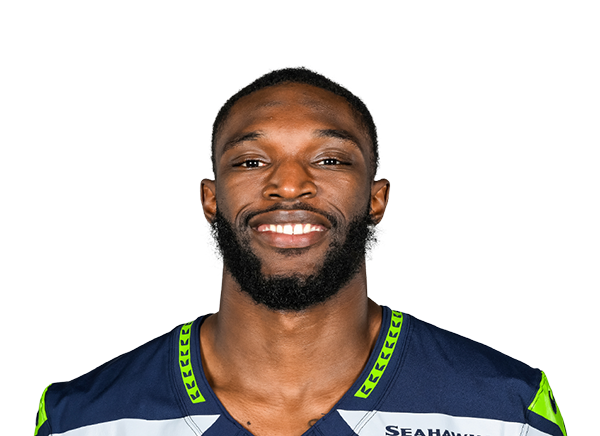 Dareke YoungQuestionable | WR | 27 | 6' 2" | 224 | 5 | Lenoir Rhyne |
|---|
| 82 | CW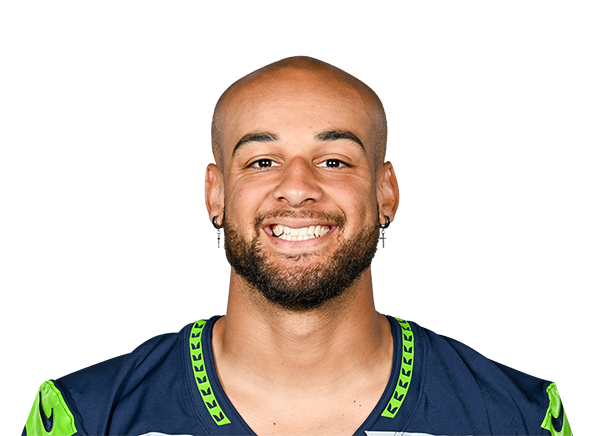 Cody White | WR | 27 | 6' 3" | 227 | 6 | Michigan State |
|---|
| 83 | DT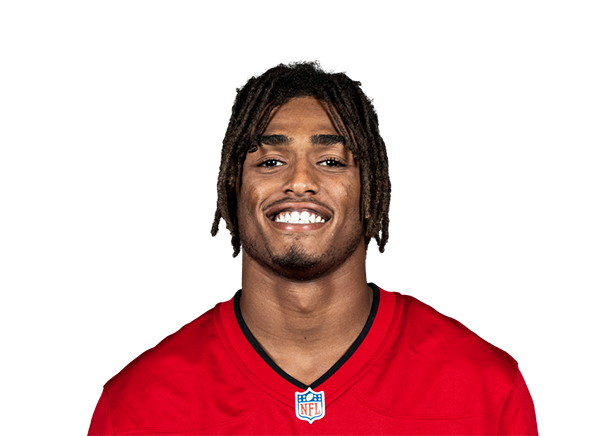 Deven Thompkins | WR | 26 | 5' 8" | 155 | 5 | Utah State |
|---|
| 41 | CM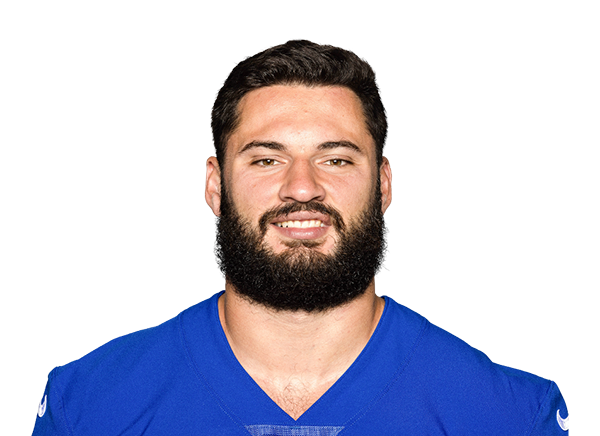 Chris Myarick | TE | 31 | 6' 5" | 261 | 5 | Temple |
|---|
| 80 | IT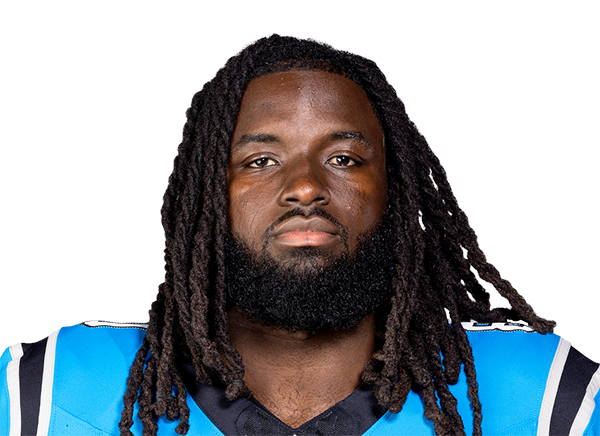 Ian Thomas | TE | 30 | 6' 3" | 253 | 9 | Indiana |
|---|
| 84 | CR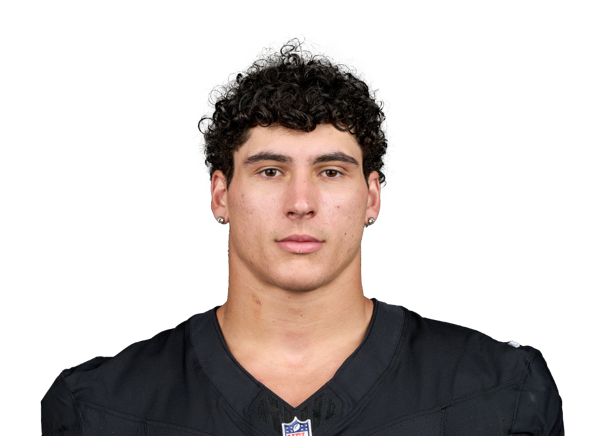 Carter Runyon | TE | 25 | 6' 4" | 243 | 2 | Towson |
|---|
| 87 | MMMichael Mayer | TE | 25 | 6' 4" | 256 | 4 | Notre Dame |
|---|
| 89 | BB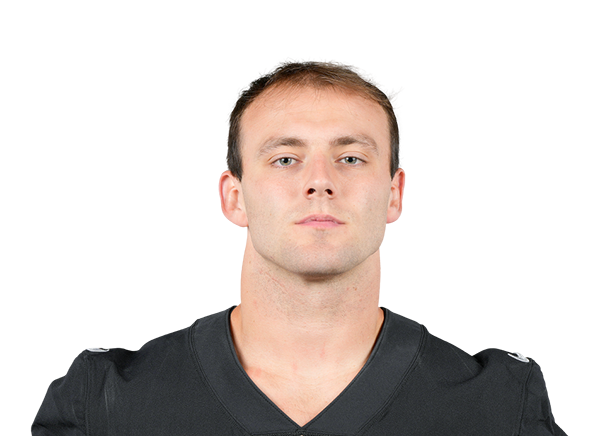 Brock BowersOut | TE | 23 | 6' 4" | 235 | 3 | Georgia |
|---|
| 60 | CG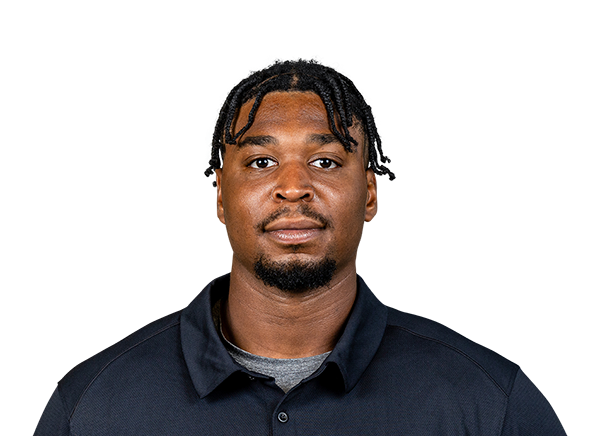 Charles Grant | OT | 24 | 6' 4" | 304 | 2 | William & Mary |
|---|
| 71 | DG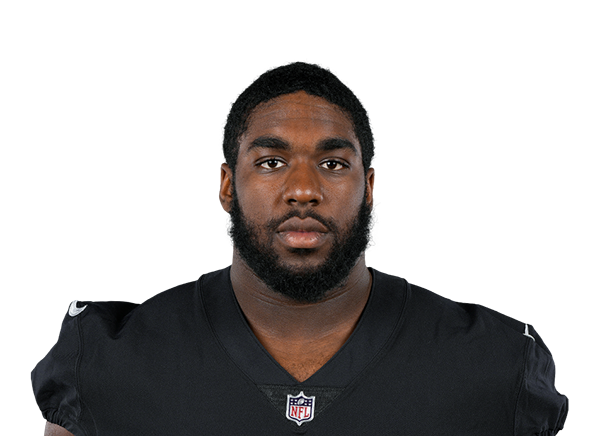 DJ Glaze | OT | 24 | 6' 4" | 331 | 3 | Maryland |
|---|
| 74 | KM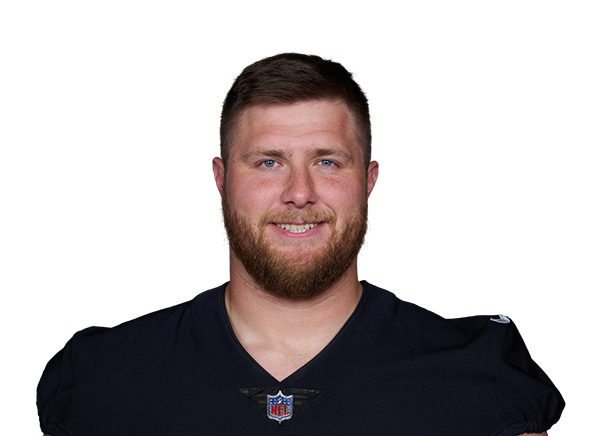 Kolton Miller | OT | 31 | 6' 8" | 326 | 9 | UCLA |
|---|
| 58 | JP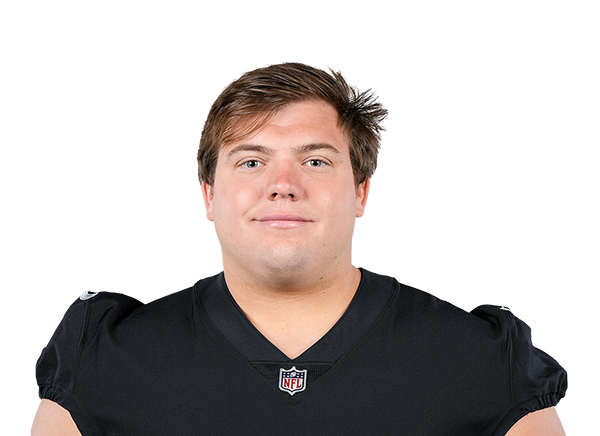 Jackson Powers-Johnson | G | 23 | 6' 3" | 325 | 3 | Oregon |
|---|
| 70 | SB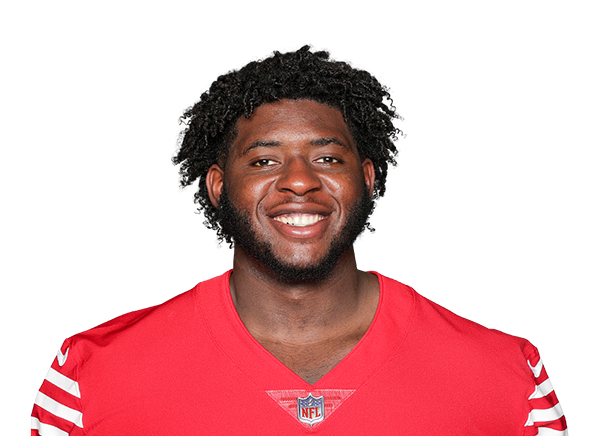 Spencer Burford | G | 26 | 6' 4" | 300 | 5 | UTSA |
|---|
| 76 | CR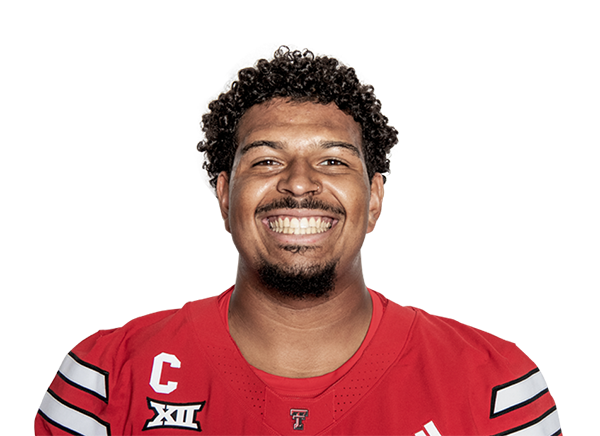 Caleb Rogers | G | 25 | 6' 4" | 312 | 2 | Texas Tech |
|---|
| 77 | BC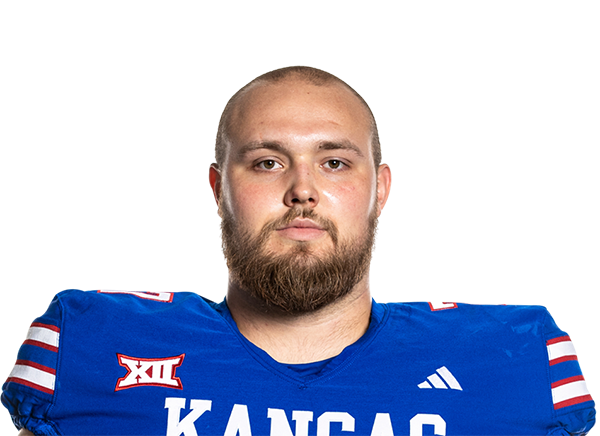 Bryce CabeldueOut | G | 25 | 6' 4" | 308 | 2 | Kansas |
|---|
| 65 | TL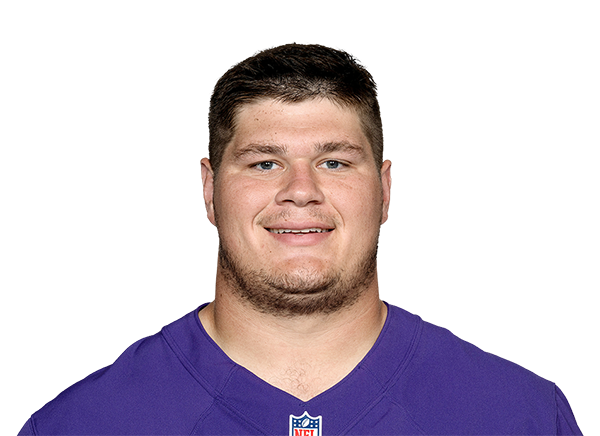 Tyler Linderbaum | C | 26 | 6' 2" | 305 | 5 | Iowa |
|---|
| 66 | TZ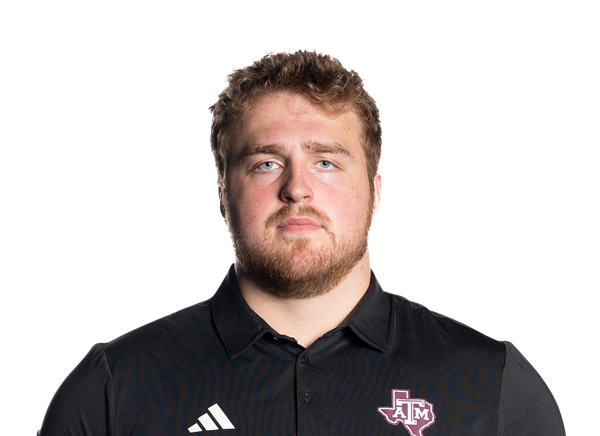 Trey Zuhn III | C | 24 | 6' 7" | 319 | R | Texas A&M |
|---|
| # | Player | Pos | Age | Ht | Wt | Exp | College |
|---|---|---|---|---|---|---|---|
| 51 | MK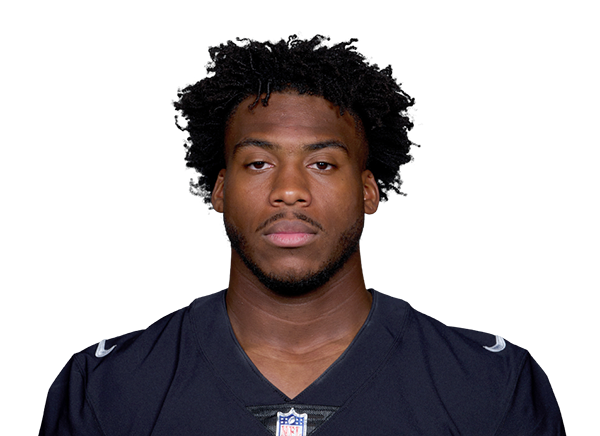 Malcolm Koonce | DE | 28 | 6' 3" | 243 | 6 | Buffalo |
| 95 | KP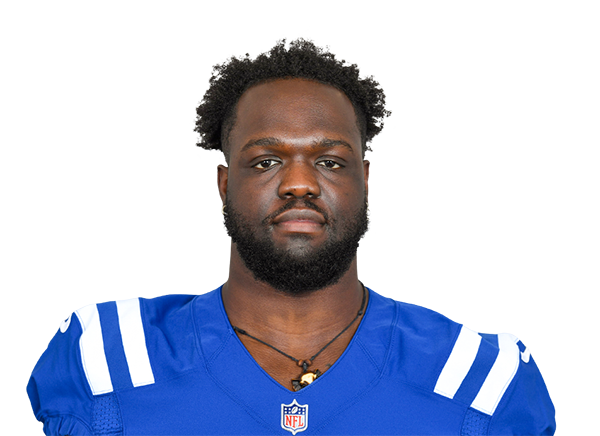 Kwity Paye | DE | 28 | 6' 3" | 265 | 6 | Michigan |
| 98 | MC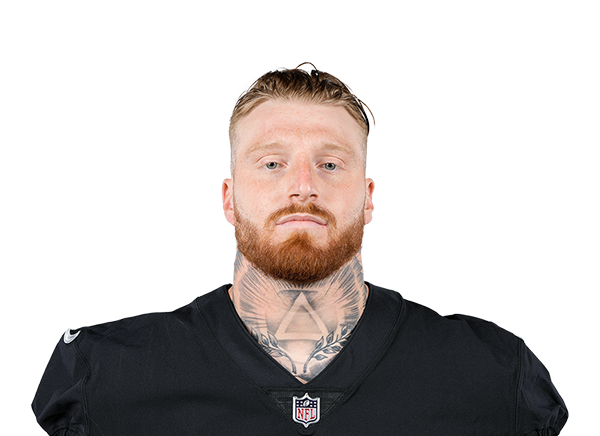 Maxx Crosby | DE | 29 | 6' 5" | 255 | 8 | Eastern Michigan |
| 69 | AB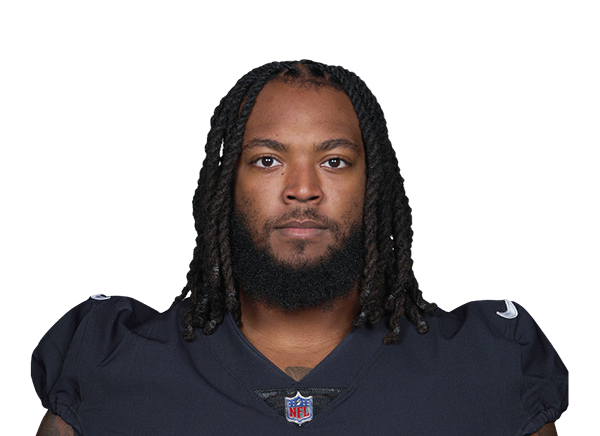 Adam ButlerQuestionable | DT | 32 | 6' 4" | 301 | 9 | Vanderbilt |
| 72 | CW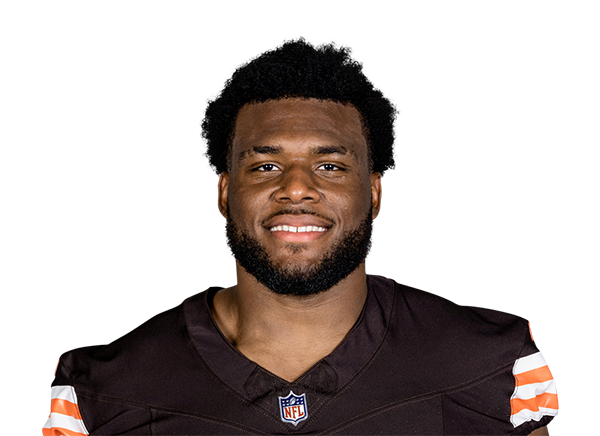 Chris Williams | DT | 28 | 6' 2" | 298 | 5 | Wagner |
| 91 | TK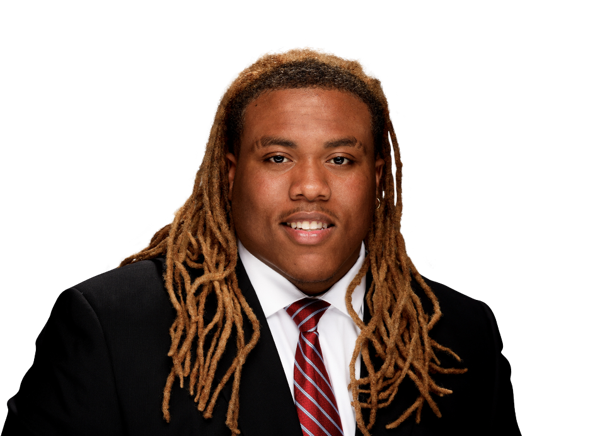 Tim Keenan IIIQuestionable | DT | 23 | 6' 2" | 320 | R | Alabama |
| 92 | JP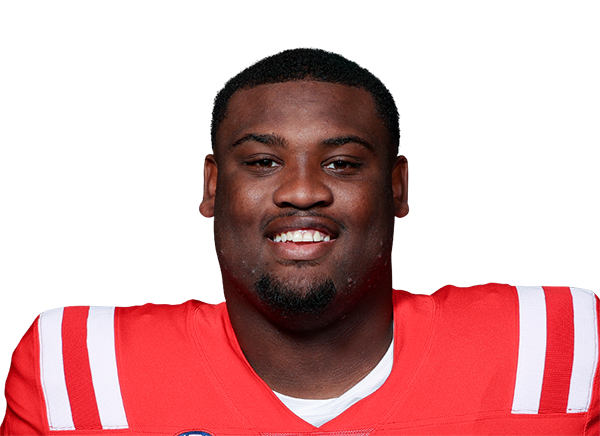 JJ Pegues | DT | 24 | 6' 2" | 325 | 2 | Ole Miss |
| 94 | FF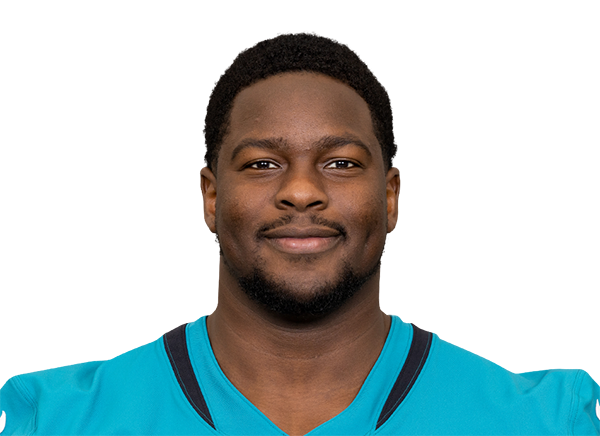 Folorunso Fatukasi | DT | 31 | 6' 4" | 318 | 8 | UConn |
| 97 | TH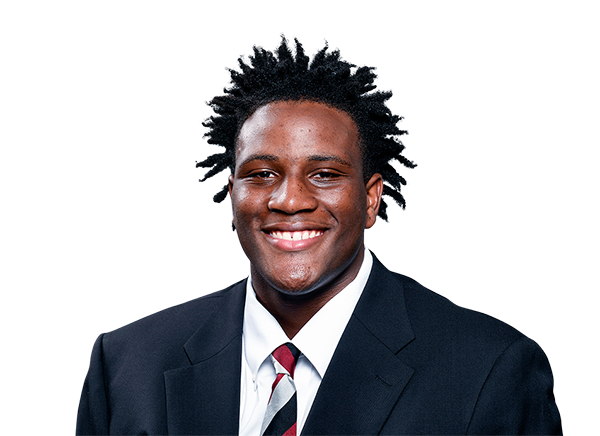 Tonka HemingwayOut | DT | 25 | 6' 2" | 284 | 2 | South Carolina |
| 99 | TB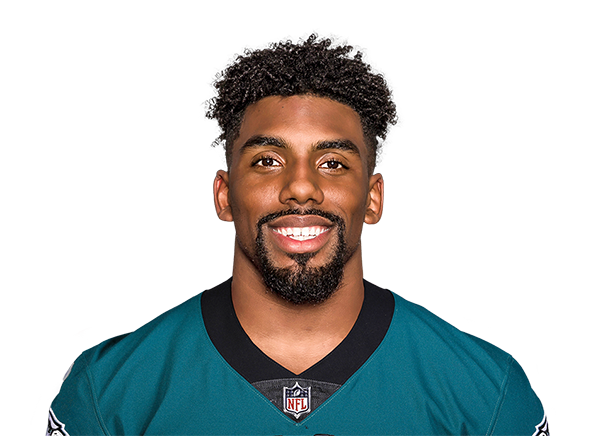 Thomas Booker IV | DT | 27 | 6' 3" | 301 | 4 | Stanford |
| 7 | QW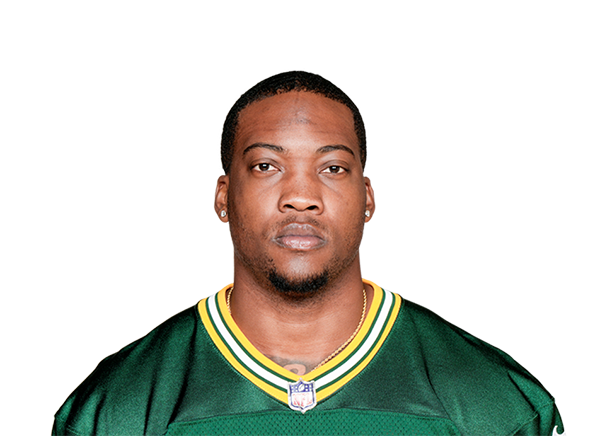 Quay Walker | LB | 26 | 6' 4" | 240 | 5 | Georgia |
| 17 | ND Nakobe Dean | LB | 25 | 5' 11" | 230 | 5 | Georgia |
| 44 | TE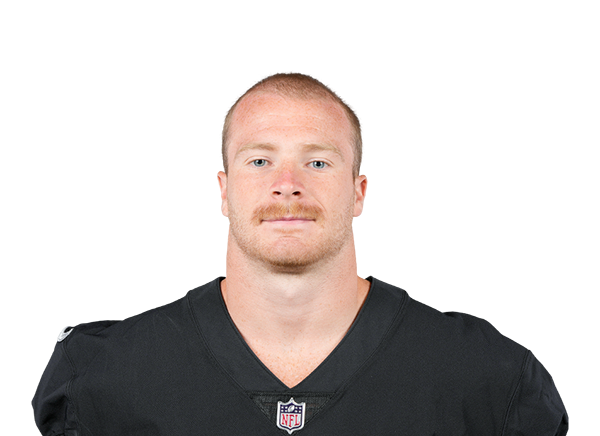 Tommy Eichenberg | LB | 25 | 6' 2" | 234 | 3 | Ohio State |
| 50 | SO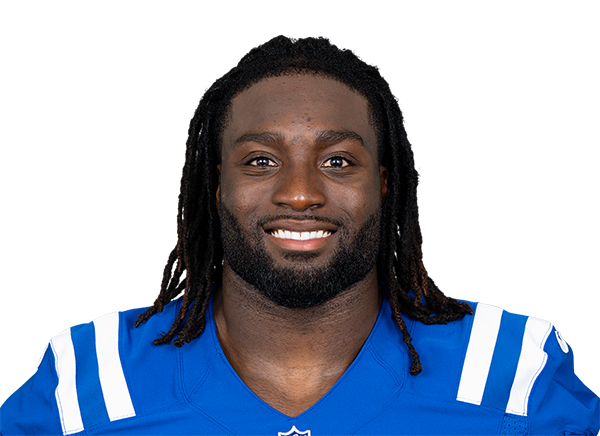 Segun Olubi | LB | 27 | 6' 2" | 220 | 4 | San Diego State |
| 55 | CL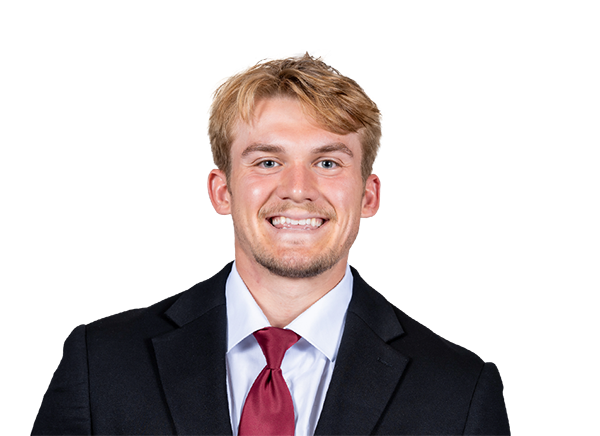 Cody Lindenberg | LB | 24 | 6' 2" | 236 | 2 | Minnesota |
| 3 | TJ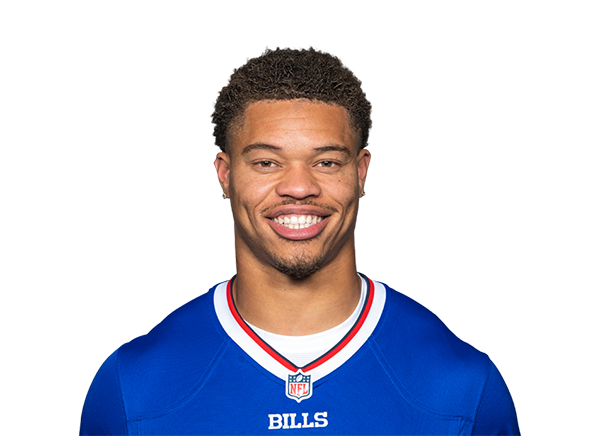 Taron Johnson | CB | 30 | 5' 11" | 192 | 9 | Weber State |
| 5 | ES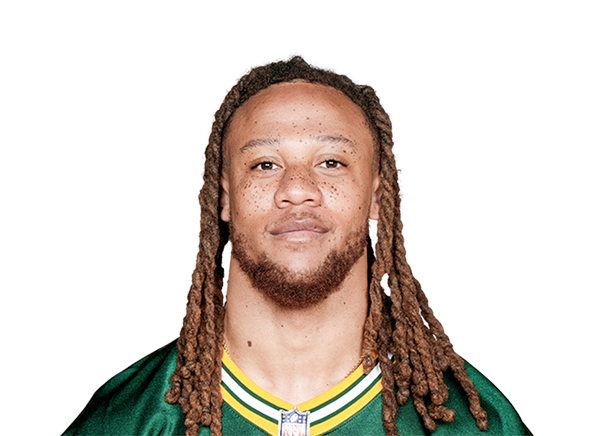 Eric Stokes | CB | 27 | 6' 1" | 193 | 6 | Georgia |
| 25 | DL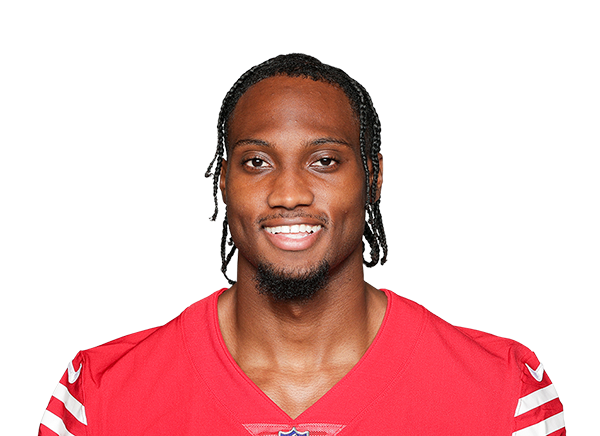 Darrell Luter Jr. | CB | 26 | 6' 0" | 190 | 4 | South Alabama |
| 26 | DP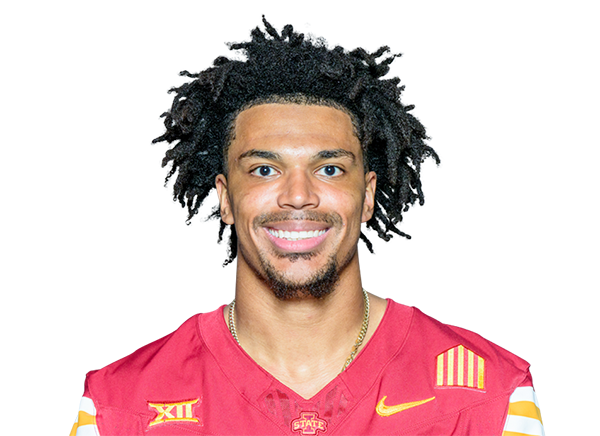 Darien Porter | CB | 25 | 6' 2" | 195 | 2 | Iowa State |
| 28 | JM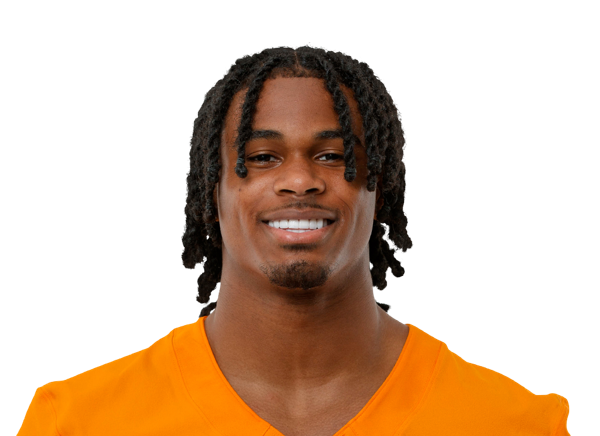 Jermod McCoy | CB | 21 | 6' 0" | 193 | R | Tennessee |
| 35 | HM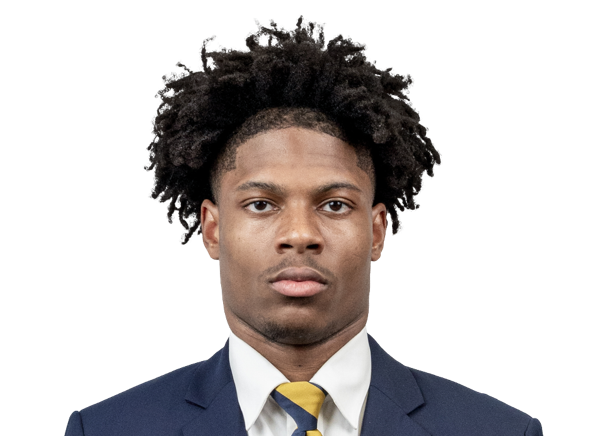 Hezekiah Masses | CB | 22 | 6' 1" | 185 | R | California |
| 11 | JC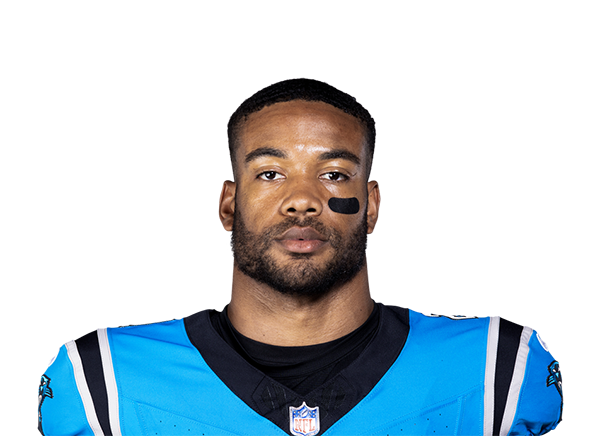 Jeremy Chinn | S | 28 | 6' 3" | 220 | 7 | Southern Illinois |
| 20 | IP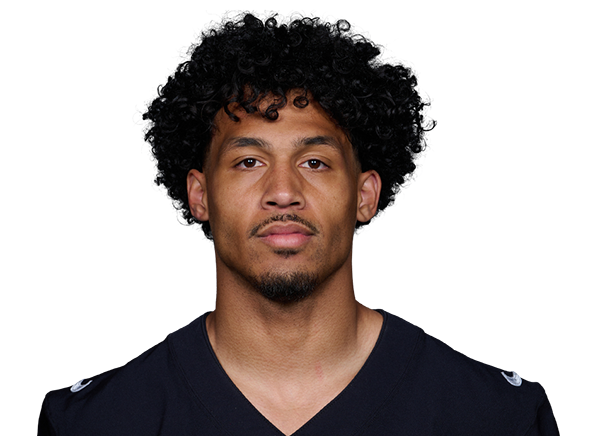 Isaiah Pola-Mao | S | 27 | 6' 3" | 204 | 5 | USC |
| 27 | TM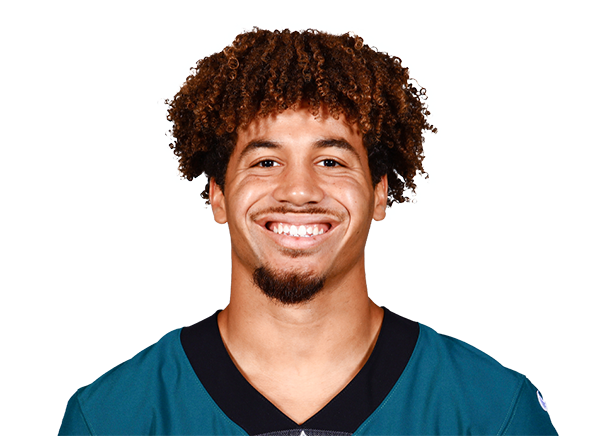 Tristin McCollumOut | S | 27 | 6' 3" | 195 | 3 | Sam Houston |
| 31 | TS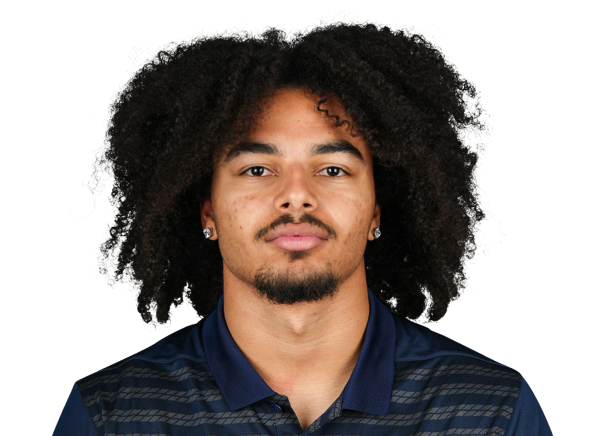 Treydan Stukes | S | 25 | 6' 2" | 200 | R | Arizona |
| 43 | DJ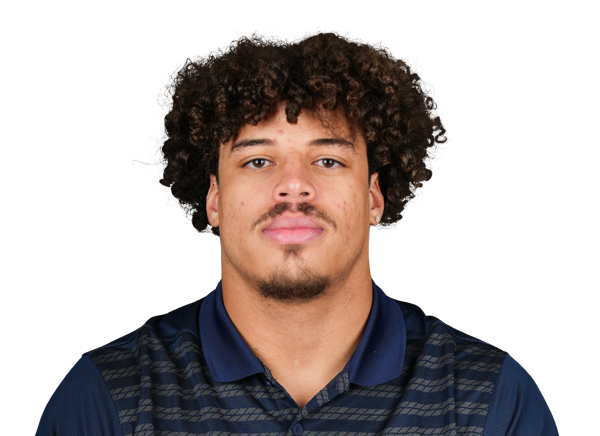 Dalton JohnsonOut | S | 23 | 5' 11" | 198 | R | Arizona |
| # | Player | Pos | Age | Ht | Wt | Exp | College |
|---|---|---|---|---|---|---|---|
| 14 | MG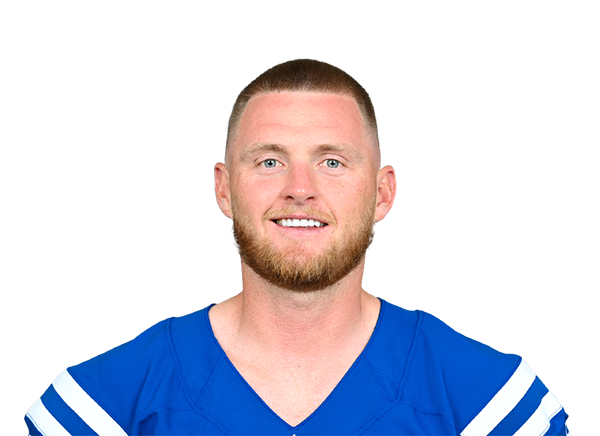 Matt Gay | PK | 32 | 6' 0" | 232 | 7 | Utah |
| 6 | AC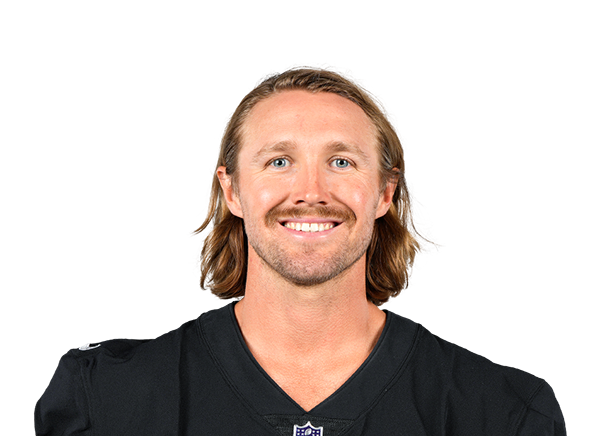 AJ Cole | P | 30 | 6' 4" | 220 | 8 | NC State |
| 47 | AW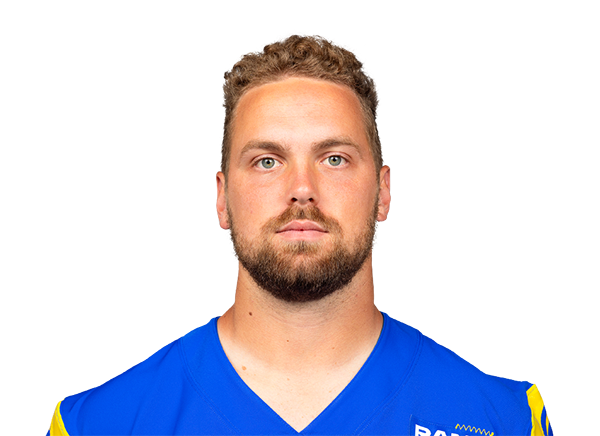 Alex Ward | LS | 27 | 6' 4" | 240 | 4 | UCF |
| # | Player | Pos | Age | Ht | Wt | Exp | College |
|---|---|---|---|---|---|---|---|
| 77 | JP Justin PickettInjured Reserve | G | 23 | 6' 7" | 317 | R | Duke |
| 42 | KC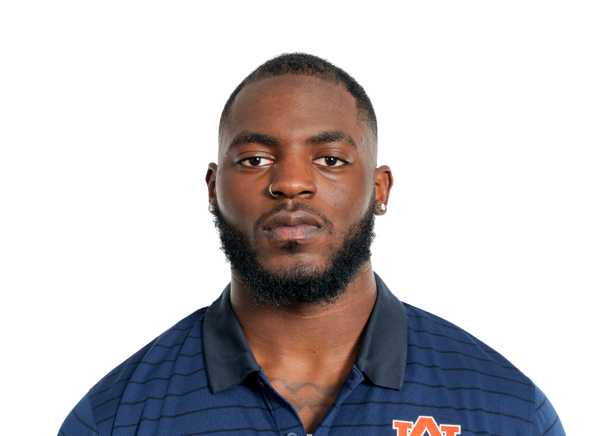 Keyron CrawfordInjured Reserve | DE | 23 | 6' 4" | 253 | R | Auburn |
| 93 | PJ Patrick JohnsonInjured Reserve | DE | 28 | 6' 2" | 248 | 6 | Tulane |
| 54 | BJ Brennan JacksonInjured Reserve | LB | 26 | 6' 4" | 263 | 3 | Washington State |
| 29 | CA Chigozie AnusiemInjured Reserve | CB | 26 | 6' 1" | 200 | 2 | Colorado State |
| # | Player | Pos | Age | Ht | Wt | Exp | College |
|---|---|---|---|---|---|---|---|
| — | BR Brett Rypien | QB | 30 | 6' 2" | 202 | 8 | Boise State |
| — | OW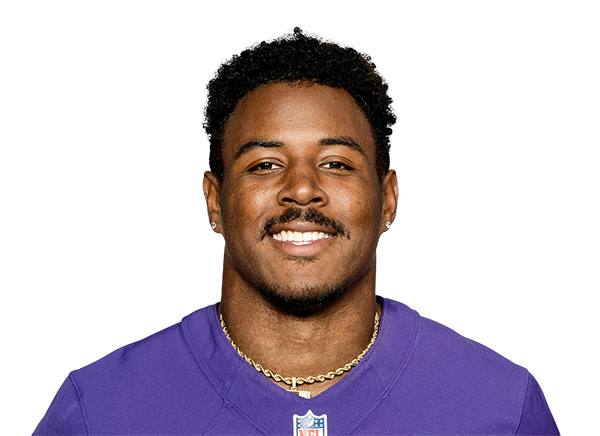 Owen Wright | RB | 27 | 5' 9" | 217 | 2 | Monmouth |
| 45 | PG Patrick Gurd | TE | 24 | 6' 4" | 250 | R | Cincinnati |
| 73 | NH Niklas Henning | OT | 23 | 6' 6" | 287 | R | — |
| 67 | WP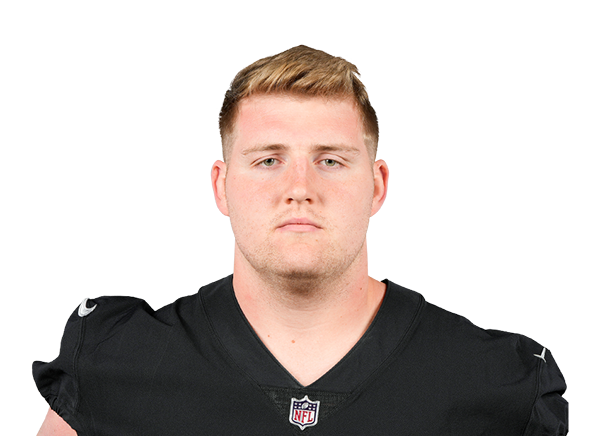 Will Putnam | C | 26 | 6' 4" | 301 | 2 | Clemson |
| 48 | CS Cian Slone | DE | 24 | 6' 3" | 239 | R | NC State |
| 96 | AG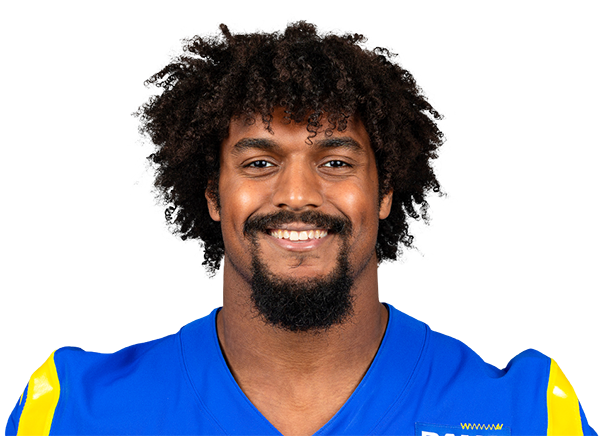 Anthony Goodlow | DE | 26 | 6' 5" | 283 | 1 | Oklahoma State |
| 90 | BC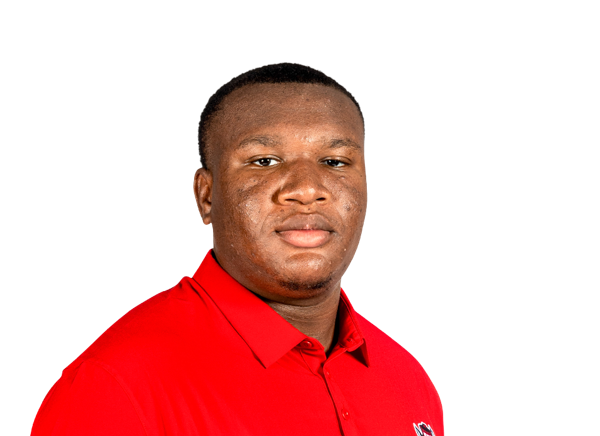 Brandon Cleveland | DT | 22 | 6' 4" | 315 | R | NC State |
| — | AO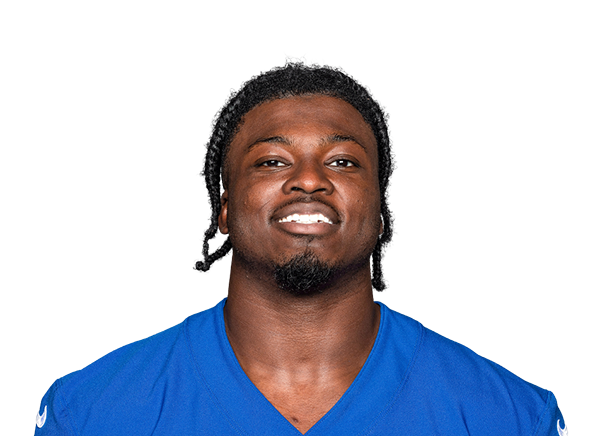 Azeez Ojulari | LB | 26 | 6' 3" | 240 | 6 | Georgia |
| 57 | CM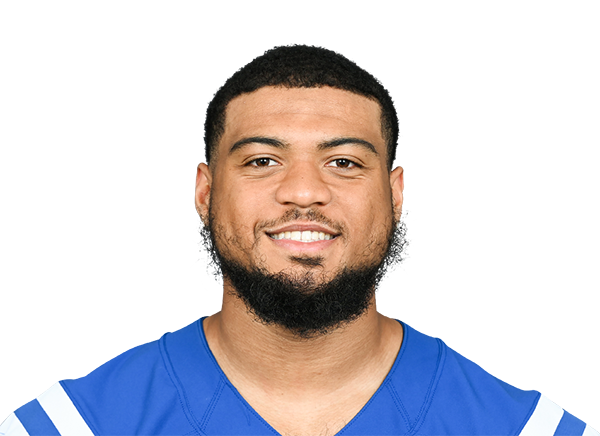 Cameron McGrone | LB | 26 | 6' 3" | 236 | 3 | Michigan |
| 22 | GV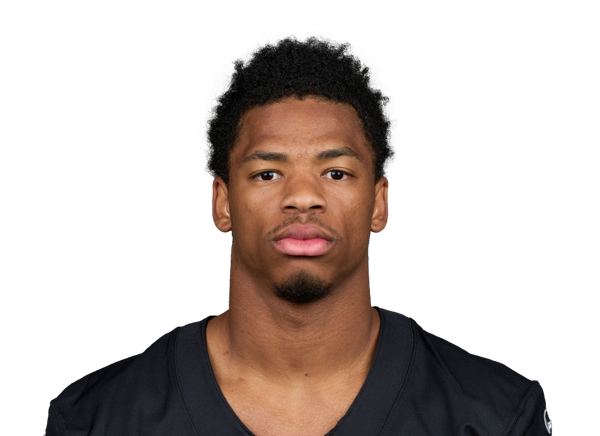 Greedy Vance | CB | 25 | 5' 9" | 177 | 2 | USC |
| 38 | KM Kansei Matsuzawa | PK | 27 | 6' 2" | 200 | R | Hawai'i |
| 9% |
| 3rd & long (7+) | 38 | 21% / 24% | 3% |
| 4th down | 6 | 17% / 22% | 17% |
| Red zone | 54 | 22% / 14% | 6% |
| Two-minute drill | 35 | 29% / 17% | 6% |
The bar shows the team's pressure rate and the tick shows the league rate. LB/DB pressure is the share of dropbacks where a linebacker or DB was credited with a sack or hit. It's a proxy for blitzing, not a true blitz rate: ESPN play-by-play doesn't log rusher counts, so blitzes that don't get home aren't visible.
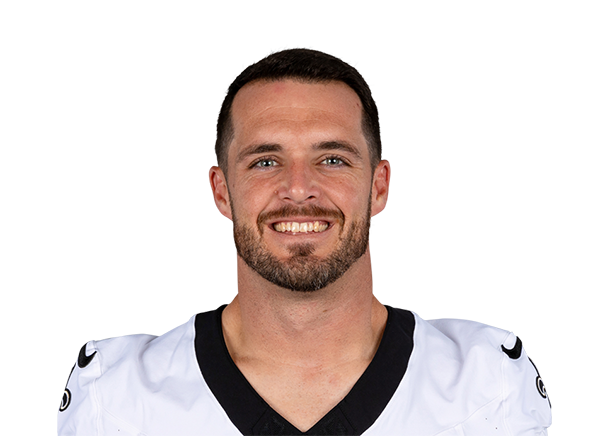
Derek Carr
2014–2022
35,222
Derek Carr
2014–2022
217
Marcus Allen
1982–1992
8,545
Marcus Allen
1982–1992
79
Tim Brown
1988–2003
1,070
Tim Brown
1988–2003
14,734
Tim Brown
1988–2003
99
Greg Townsend
1983–1997
107.5
Terry McDaniel
1989–1997
34
Greg Biekert
1993–2001
900
Totals are regular-season stats while with this franchise, built from ESPN records (full statistical coverage from 1982 onward). Players whose careers ended before that may be missing.