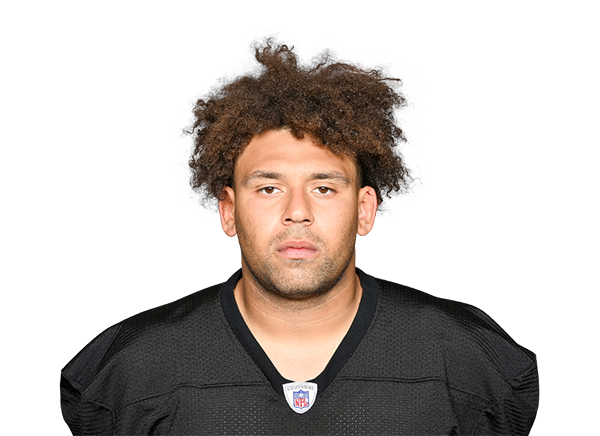
Connor Heyward is trending up: 1.3 PPR per game over his last two games (Weeks 8 and 10), vs. 0.7 in Weeks 1, 2, 3, 4, 5 and 7.
Full analysisBased on 8 games of box scores. Small samples swing on one big play or touchdown. Route participation and snap counts aren't in the data, so opportunity is measured by targets and carries, and role changes stay unconfirmed.
| Metric | LatestWeek 10 vs SEA | Last 2 gamesWeeks 8 and 10 | Earlier averageWeeks 1, 2, 3, 4, 5, 7 and 8 | Season averageWeeks 1, 2, 3, 4, 5, 7, 8 and 10 |
|---|---|---|---|---|
| Carry shareOpportunity | 0% | 2% | 2% | 2% |
| Carries + targets per gameOpportunity | 2.0 | 1.5 |
fantasy pts / game (PPR)
His carry share held steady in Week 10 (0%, vs. 2% in Weeks 1, 2, 3, 4, 5, 7 and 8), so his opportunity has not changed meaningfully.
His Week 10 output (2.6 PPR) was close to his average in Weeks 1, 2, 3, 4, 5, 7 and 8 (0.6).
Based on 2026 play-by-play data.
Archetype
5 NFL seasons and 68 career rushing yards. Best year: 43 in 2025.
| Season | Team | GP | CAR | YDS | AVG | TD | LNG | FD | FUM | LST |
|---|---|---|---|---|---|---|---|---|---|---|
| 2022 | PIT | 17 | 2 | 27 | 13.5 | 0 | 21 | 2 | 0 | 0 |
| 2023 |
| 1.0 |
| 1.1 |
| Yards per carryEfficiency | 0.0 | 0.0 | -0.4 | -0.4 |
|---|
| TD points per gameTouchdowns | 0.0 | 0.0 | 0.0 | 0.0 |
|---|
| PPR points per gameResult | 2.6 | 1.3 | 0.6 | 0.8 |
|---|
Over the season (Weeks 1, 2, 3, 4, 5, 7, 8 and 10) he draws 1% of LV's targets. At this share he needs big plays or touchdowns to produce.
-0.4 yards per carry over the season (Weeks 1, 2, 3, 4, 5, 7, 8 and 10) (the typical RB is at 4.0), and 0.0 over his last two games (Weeks 8 and 10). Production is being propped up by volume more than explosiveness.
Over the season (Weeks 1, 2, 3, 4, 5, 7, 8 and 10), 0% of his fantasy points came from touchdowns. His yardage is doing the work, so there is upside if the touchdowns start coming.
| @ LAC |
| — |
| — |
| — |
| — |
| 1 |
| 1 |
| 0 |
| — |
| — |
| — |
| — |
| 0.1 |
| 3 | @ NO | — | — | — | — | — | — | — | — | — | — | — | 0.0 |
|---|
| 4 | vs KC | — | — | — | — | 2 | -4 | 0 | 1 | 1 | 9 | 0 | 1.5 |
|---|
| 5 | @ NE | — | — | — | — | — | — | — | — | — | — | — | 0.0 |
|---|
| 7 | vs LAR | — | — | — | — | — | — | — | 1 | 1 | 13 | 0 | 2.3 |
|---|
| 8 | @ NYJ | — | — | — | — | 1 | 0 | 0 | — | — | — | — | 0.0 |
|---|
| 10 | vs SEA | — | — | — | — | — | — | — | 2 | 2 | 6 | 0 | 2.6 |
|---|
| PIT |
| 17 |
| 1 |
| 0 |
| 0.0 |
| 0 |
| 0 |
| 0 |
| 0 |
| 0 |
| 2024 | PIT | 17 | 0 | 0 | 0.0 | 0 | 0 | 0 | 0 | 0 |
|---|
| 2025 | PIT | 17 | 15 | 43 | 2.9 | 2 | 29 | 11 | 0 | 0 |
|---|
| 2026 | LV | 10 | 5 | -2 | -0.4 | 0 | 1 | 3 | 0 | 0 |
|---|
| Career | 78 | 23 | 68 | 3.0 | 2 | 29 | 16 | 0 | 0 | |
|---|---|---|---|---|---|---|---|---|---|---|

 Las Vegas Raiders